- Investing With Brandon Alpha Report
- Posts
- Alpha Report Special Issue #1
Alpha Report Special Issue #1
BOOM or BUST, The Current State of The Market
Brandon
December 14, 2024
The Current State of The Market👇
This is my first Special Issue Alpha report I am sending out to everyone.
I will do this probably on a weekly basis but it depends on if I feel the info is needed to be out there.
I send out my regular issues every day the market is open.
So for this report, I am going to break down the current state of the market and what I see going forward.
Everything I say here I feel is important cause I know your time is important.
So let’s dive in to valuations, interest rates, innovation, risks, outlooks.
The Break Down👇
The forward PE of the SP500 = 22 ish
The forward PE of the Nasdaq = 28 ish
The PE for the nasdaq is usually higher cause it’s is pricing in more growth.
So how does this size up historically?
Look at this chart for SP500 Forward PE👇
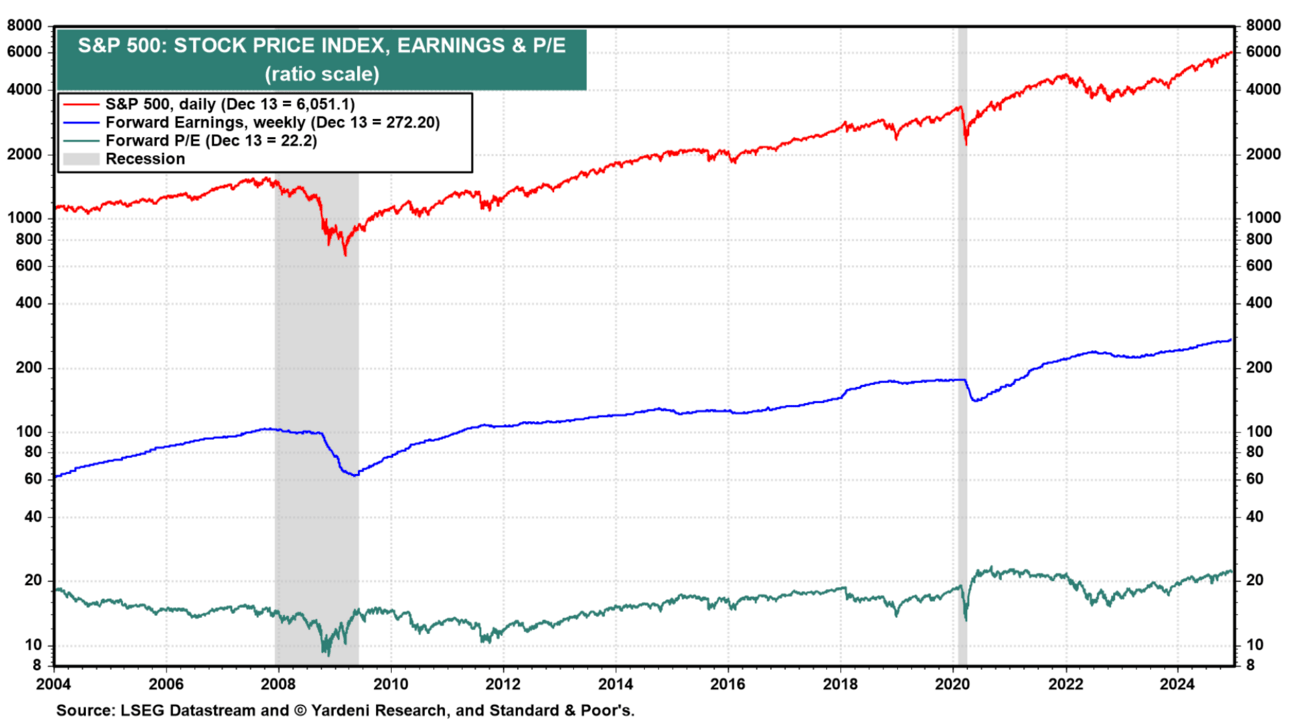
The green line on the bottom is the forward PE for the SP500 (22.2)
Look at this chart for SP500 Trailing PE👇

You can see, the PE ratio (30.98) for the SP500 is at levels only seen a few times in the last century.
So the reason why the trailing PE looks high and forward looks lower is because a lot of earnings growth is expected next year. Earnings growth while assuming no stock price growth means a lower PE.
But That Is Not Enough Info To Make A Valuation Conclusion👇
Yes things look a little expensive now based on historical norms, but there is one key difference now vs historical norms. INTEREST RATES.
Check out this chart below.
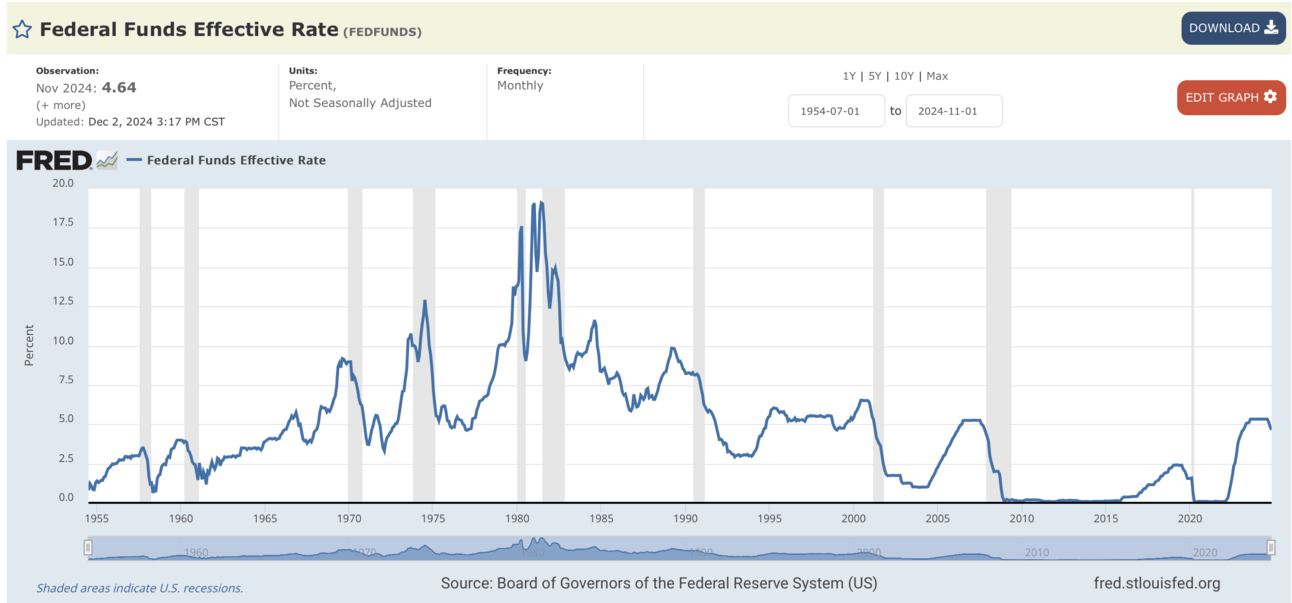
We are currently at 4.64% and more rate cuts are coming
Since 1980, interest rates have been on a bumpy, but steady decline to current.
Yes I know we are “locally” higher now but we are in a cutting cycle and more are expected to come next week and next year.
I expect we will cut to around 3% ish which is what the fed indicated the neutral rate is. So we still have some more cutting to go.
So why do I care about this chart?
Well, it matters A LOT!
Rates are like gravity on the stock market.
The easiest way to explain this is with an example.
Let’s say you have $100k to invest. You can chose between a “risk free” government bond for a 9% annual interest rate, or you can choose to invest in the stock market and get a “risky” 10% annual return on average, but it is bumpy.
Most investors will go with the bond cause its a guaranteed 9% and its not worth the “risk” to chase after another 1% in the stock market.
Ok now let’s flip it. What if the bonds were at 3% and and stock market is 10%. Are most people going to waste their time with a bond? Prob not.
So that is why when rates go down, stocks usually have multiple expansion (PE ratios go higher) which means stock prices go up because there is really no other game in town.
So Based On This Info, Where Are We Now?👇
Well, things look expensive on a trailing basis (past 12 months) but looking forward, things don’t seem to be crazy expensive.
The more rate cuts we get and assuming the economy stays strong, and expected earnings growth actually materializes, the higher the stock market can fly.
There are plenty of stocks right now that are clearly over valued and disconnected from the fundamentals.
But the indexes are what matters the most. Everything is indexed nowadays and if the index tanks, most of the companies within that index will fall too.
So the market is pricing in strong growth in the future.
There is lots of hype around deregulation with Trump, AI, Tech, and new breakthroughs to make companies much more efficient.
If that actually materializes to the bottom line of these companies (earnings), that will justify the valuations levels now. But if the growth does not come, the market will correct lower.
Companies that have a durable competitive advantage will do great, while others that do not adopt AI and stay relevant will be destroyed.
I feel this is the Industrial Revolution for tech right now. (rawring 20s)
So Is The Market Over Valued?👇
Maybe a little.
Earnings are the number one thing that matters to what a stock does in the long run.
Lets look at the annual growth rate for the last 5 years and add it together then compare this against what the SP500 share price did.
2020 = -32%
2021 = 110%
2022 = -12%
2023 = 11%
2024 = 14%
So if we add that up in a simple way that = 91% earnings growth in the last 5 years.
The SP500 index price went up 91% in the last 5 years too.
Funny how that works out huh… EARNINGS MATTER!
So overall, I feel the market is pricing in a lot of growth and if the growth actually happens, we are at fair value now. If the growth flops, we are over valued now. I like to have a margin of safety so I will discount the future growth a little. So right now I view us as 10% over valued ish. But keep in mind, the market can swing all over and maybe it will swing to 30% under valued which equals a 40% drop. Not saying that will happen but if it does I will be getting a lot of deals!
Stay the course and have a good weekend!