- Investing With Brandon Alpha Report
- Posts
- Alpha Report Issue #68
Alpha Report Issue #68
Current State of The Market & How To Capitalize
Brandon
February 16, 2025
Hey guys!
I will be sending out my Alpha Report for FREE every Sunday!
I always want to create more value for you guys and this report is only going to get better!
Enjoy!
-Brandon

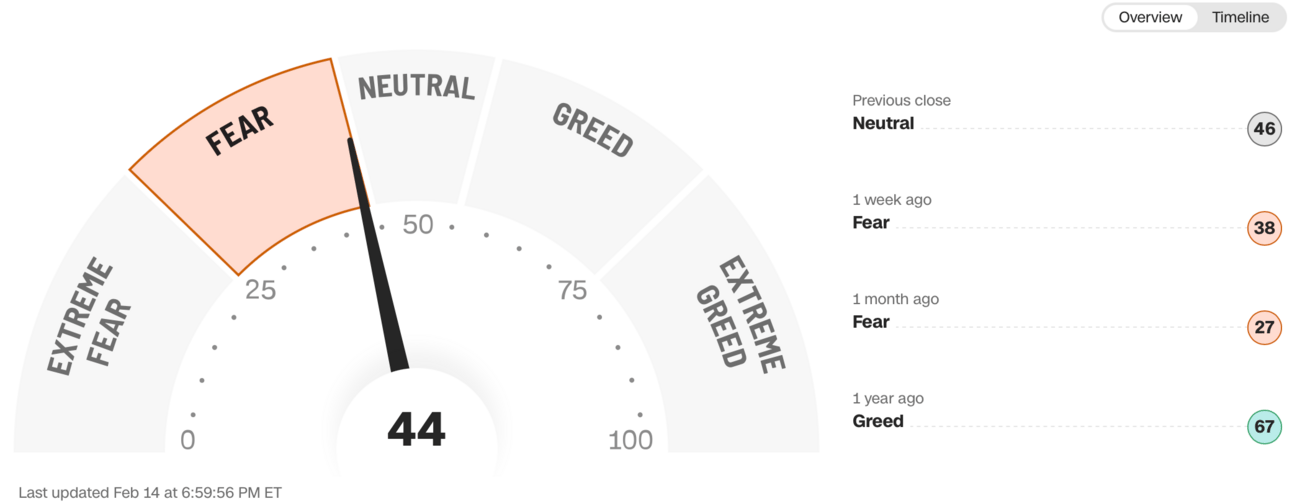
Current Fear & Greed Index👇
Current read is 44 on the fear greed index.
I feel that we are closer to 60 vs what this says, so a little greedy!
Market Fearful = Potential Opportunity/Deals.
Market Greedy = Potential Over Valuation.
Current Interest Rates👇
30 year fixed mortgage rate falls to 6.95% Today vs 6.97% last Sunday.
10 year treasury bond yield falls to 4.47% Today, vs 4.53% last Sunday.
2 year treasury bond yield falls to 4.26% Today, vs 4.30% last Sunday.
Current State of The Market👇
Stocks are close to ATHs, bond yields are trending higher, earnings season is wrapping up, & Trumps policies are being digested… So I will give you the info that matters, then I will break it down at the end!
Stocks👇
Let’s look at the progress we made in the last 10 years just to get an idea of how good the market has really been.

$10k investment in SP500 vs Nasdaq (QQQ) 10 years ago.
So by doing a $10k purchase in the nasdaq 10 years ago and did NOTHING, it would have grown to $55,960 with dividends reinvested today.
That is the power of the American tailwind, being patient, and ignoring news headlines.
You just had to buy & hold…
So What Is Pushing Stocks Higher?👇
Take a look at this chart here which is one of the most important charts you will see in a while.

The blue line is the S&P500 stock chart.
The black line is the forward EPS of the S&P500.
You guys know I said it a million times, earnings are the number one thing that matters to what a stock is going to do in the long run.
BUT, notice the disconnect the last few years?
The SP500 price is pushing up much faster than what froward earnings are expected to be at.
This is a problem!
Things are becoming more expensive because of the HUGE growth expectations being priced into the market. (stock prices going up, but earnings not following)
Is that justified?
Well… not yet!
Enthusiasm over the Tech & AI revolution has led to significant multiple expansion (increase in PE ratios) over the last few years.
The Forward 12 month S&P500 PE ratio is currently at 22.2, which is levels only seen 2 other times in the last 40 years.
You can see this on the chart below.

If the high growth expectations get met, stocks very well can trend higher.
If the high growth expectations miss, stocks will correct lower!
It’s all an expectations vs reality game!
Bonds👇
Bonds are VERY important!
Warren Buffet himself said “Interest rates act on financial valuations the way gravity acts on matter: The higher the rate, the greater the downward pull."
So the federal reserve has been very active the last few years with interest rates.
Inflation spiked post Covid and the fed was slow to raise interest rates to help combat it right away.
So they waited, and a huge wave on inflation hit!
Should have raised rates sooner, but of course hindsight is always 20/20.
The chart below shows what inflation was at since 2005.

Inflation peaked at 9.1% in June 2022 & is currently at 3%
So what did the fed do to push inflation down? They raised interest rates, which creates less demand in the economy.
Less demand = More supply.
More supply = lower prices usually.
The chart below shows the federal reserve interest rates since 2005.

So you can see the correlation, higher rates did slow down inflation.
Why? Because everything is more expensive!
Car loans, credit cards, homes, really anything that needs to be financed…
Less demand in the economy to spend money = prices usually fall.
That is a very simple supply and demand function.
But something interesting is happening right now…
The fed has cut rates from roughly 5.33% to 4.33% in the last year.
So that should drop interest rates and spark the economy right?
SHOULD! But it did NOT!
Look at this chart below of the 30 year mortgage rate.

So even as the fed was cutting interest rates from 5.33% ish to 4.33% ish, mortgage rates actually jumped from 6% ish to now 7% ish in that same time period.
This is also happening with bond yields too… They are shooting up!
So why the disconnect?
The “market” does not believe that inflation is going to stay down & recent reports also suggest that from CPI & PPI.
So the market is building in higher inflation expectations into bond yields, which is bad for stocks…
Higher inflation = higher rates.
Stocks vs Bonds👇
These 2 charts are ULTRA important to understand.
Let’s cover this, then I will bring everything together!

Chart #1

Chart #2
Have you wondered why Warren Buffett has been selling stocks and buying bonds? This chart explains why!
Chart #2 represents the equity risk premium which is the difference between the S&P 500's earnings yield and the real bond yield.
This means it shows how much extra return investors are getting from stocks compared to bonds.
Right now, that premium is around 3%, indicating stocks are only slightly more attractive than bonds.
Compare this to 2012, when the spread was around 10%, meaning stocks were extremely attractive relative to bonds at that time.
Chart #1 is just another way to look at this.
As a rule of thumb, stocks & bonds compete with each other.
Bonds = “risk free ROI”
Stocks = “risky ROI”
The closer bond returns get to stock returns, the more compelling bonds become.
This will cause multiple contraction (PE ratios to drop) because the money is then being deployed in bonds from stocks.
In english, stock prices will fall cause bonds are more attractive.
Ok! Summarize it!👇
Stocks are expensive: The S&P 500 has been rising faster than forward earnings expectations, meaning valuations are stretched. The forward P/E ratio is at 22.2, a level only seen twice in the last 40 years. This suggests a lot of optimism is already priced in, largely fueled by AI and tech enthusiasm.
Bonds are looking more attractive: The equity risk premium (the extra return stocks offer over bonds) has shrunk to just 3%, far lower than the 10% we saw in 2012. This is why Warren Buffett has been shifting from stocks to bonds. The risk reward balance is no longer overwhelmingly in favor of equities (stocks)
Interest rates and inflation are still uncertain: The Fed has cut rates from 5.33% to 4.33%, but long term borrowing costs (like mortgage rates) haven’t dropped…they’ve actually risen. This suggests markets don’t believe inflation is under control yet, which is keeping yields high.
So What Do I Think Right Now?👇
Stocks aren’t cheap anymore. The market is pricing in huge growth expectations, but earnings haven’t caught up yet. That’s a red flag. We NEED earnings to continue to come in amazing with solid guidence to support the current valuation.
Bonds are starting to look more competitive, which could draw capital away from stocks.
The Fed is walking a tightrope… They want to cut rates, but inflation isn’t fully tamed. This uncertainty could keep markets volatile.
The last few years have been SUPER EASY! But right now, the market is at an inflection point. The next few months will tell us if earnings can catch up or if stocks need to correct!
This Is How I Win No Matter What!👇
Right now, the stock market is booming with opportunity, but let’s be real, a lot of companies are extremely overpriced when you look at the fundamentals.
I don’t chase hype.
I focus on making ultra high margin of safety plays.
This month alone, I’ve already generated $56,000 with stock options in a low risk way!
Yes, $56,000. In one month. And the best part? That cash hits my account immediately when I open these trades.
I can then take that cash and buy more shares, or withdraw it to live on.
But here’s the thing… if you don’t know what you’re doing, you can get crushed.
You need to know how to value a company so you don’t overpay.
You need to know when to get in and when to get out to maximize profits.
You need to know how to manage risk so one bad trade doesn’t wipe you out.
Most traders rely on guesswork. That’s why they lose money.
I have a proven system that helps me find these high probability setups over and over again. And I teach it all inside my course.
Markets are uncertain, risks are rising, and most traders are blindly throwing money into stocks they don’t even understand. Don’t be one of them. Learn the right way to trade and start winning consistently.
🔗 Click below and get started RIGHT NOW!
FYI, prices went up 2 days ago, and they will go up again!
Economic Calendar For: Feb 10-14, 2025
All times in PST
Monday, Feb 17👇
Stock Market Closed (Presidents Day)
Tuesday, Feb 18👇
Arista Networks Earnings (post market)
Wednesday, Feb 19👇
11a Fed Minutes
Thursday, Feb 20👇
530a Initial Jobless Claims
Walmart Earnings (pre market)
Alibaba Earnings (pre market)
Rivian Earnings (post market)
Friday, Feb 21👇
7a Consumer Sentiment
I will be breaking all of this down in real time in course members only discord!
👇Price Targets For End Of Year 2025
(updated daily)
I moved all trades and potential plays to course members ONLY Discord!
Take your game to the next level. Do my course. Come into my mastermind Discord!
QQQ - $560
VOO- $575
IWM- $240
SOXX- $240
TSLA - $390
NVDA- $175
AAPL - $250
PLTR- $85
AMZN- $255
GOOG - $200
MSFT - $445
JPM - $295
SOFI - $12
TSM - $225
AMD - $135
META - $750
BITCOIN - $95,000
SOLANA - $240
👇Price Targets For End Of Year 2030
QQQ- $830 (assuming 8% annual ROI)
VOO- $830 (assuming 7% annual ROI)
SOXX- $360 (assuming 8% annual ROI)
TSLA- $1,200 (assuming 18% annual ROI)
NVDA- $645 (assuming 25% annual ROI)
AAPL - $375 (assuming 7% annual ROI)
AMZN- $550 (assuming 15% annual ROI)
MSFT - $1,000 (assuming 15% annual ROI)
NVDA - $1,250 (assuming 45% annual ROI)
(of course a lot of these will split, this is non split adjusted)
👇Current Value of My Trading Account👇
(updated daily)
👇Yearly Account Account Value
December 2018 - $0
December 2019 - $45,251
December 2020 - $150,191
December 2021 - $267,524
December 2022- $290,315
December 2023 - $506,223
December 2024 - $927,796
IN PROGRESS 2025 - $969,260

Current value of my Schwab account.
👇Portfolio Thoughts
Amazing growth from 2018 to Current all off of a total contribution of $90,000.
That is over a 10x in 7 years!
I did this in a very low risk and conservative way.
Month to month and even year to year volatility is irrelevant.
I see volatility as opportunity!
My goal is $5,000,000 in this account by 2030.
I see this as very achievable and if the market dips further, I will capitalize heavily, just like I did in 2022!
Stay the course and keep your emotions in check!