- Investing With Brandon Alpha Report
- Posts
- Alpha Report Issue #61
Alpha Report Issue #61
Current State of The Stock Market
Brandon
February 05, 2025
Hey guys!
I will be sending out my Alpha Report for FREE every day the market is open!
I always want to create more value for you guys and this report is only going to get better!
Enjoy!
-Brandon

Today’s Heat Map👇

Wednesday February 5, 2025 RECAP👇
Market pushed higher today because there was essentially no bad news with regards to tariffs & a trade war.
The market is in a weird state now & this needs to be broken down!
More on this below.
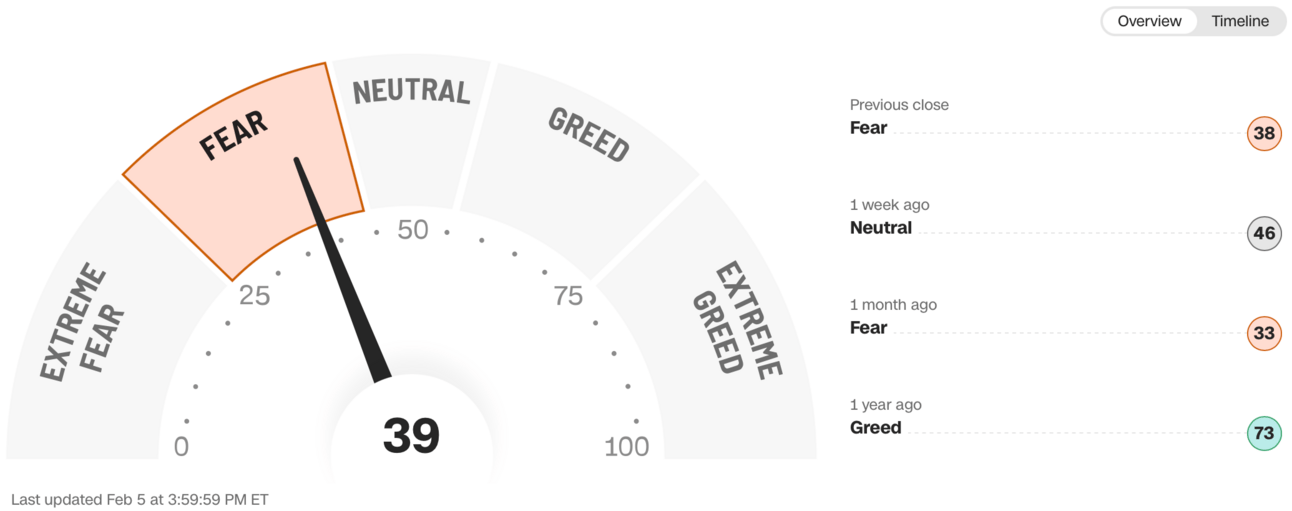
Fear & Greed Index For Today👇
39 Today & 39 Yesterday.
I feel that we are closer to 60 vs what this says.
This index is overly fearful in my opinion right now.
Today’s Economic Updates👇
30 year fixed mortgage rate falls to 6.86% Today vs 6.98% Yesterday.
10 year treasury bond yield falls to 4.43% today, vs 4.51% Yesterday.
2 year treasury bond yield falls to 4.19% today, vs 4.21% Yesterday.
Quick note for the above rates, It is GOOD that bond yields are falling!
This makes bonds less attractive, and stocks more attractive.
Breakdown From Today’s ADP January Jobs Report👇
Private-sector job growth today was 183k (higher than the expected 150k)
Revised December jobs: 176k (previously reported as 122k)
Unemployment rate: Holding around 4%.
Overall, job growth remains strong but cooling slightly.
The biggest lie about wealth building: "It takes money to make money."
It takes discipline, time, and a plan.
Money follows knowledge and effort.
— Investing With Brandon (@Invest_Brandon)
7:00 AM • Feb 5, 2025
Current State of The Market👇
I will break down the current state of the stock market by looking at valuations, interest rates, macro, & my current thoughts.
Key Takeaways👇
So let’s start with the current market valuations.
The forward PE of the SP500 = 22 ish
The forward PE of the Nasdaq = 26 ish
The PE for the nasdaq is usually higher cause it’s is pricing in more growth.
So how does this size up historically?
Look At This Chart For SP500 Forward PE👇
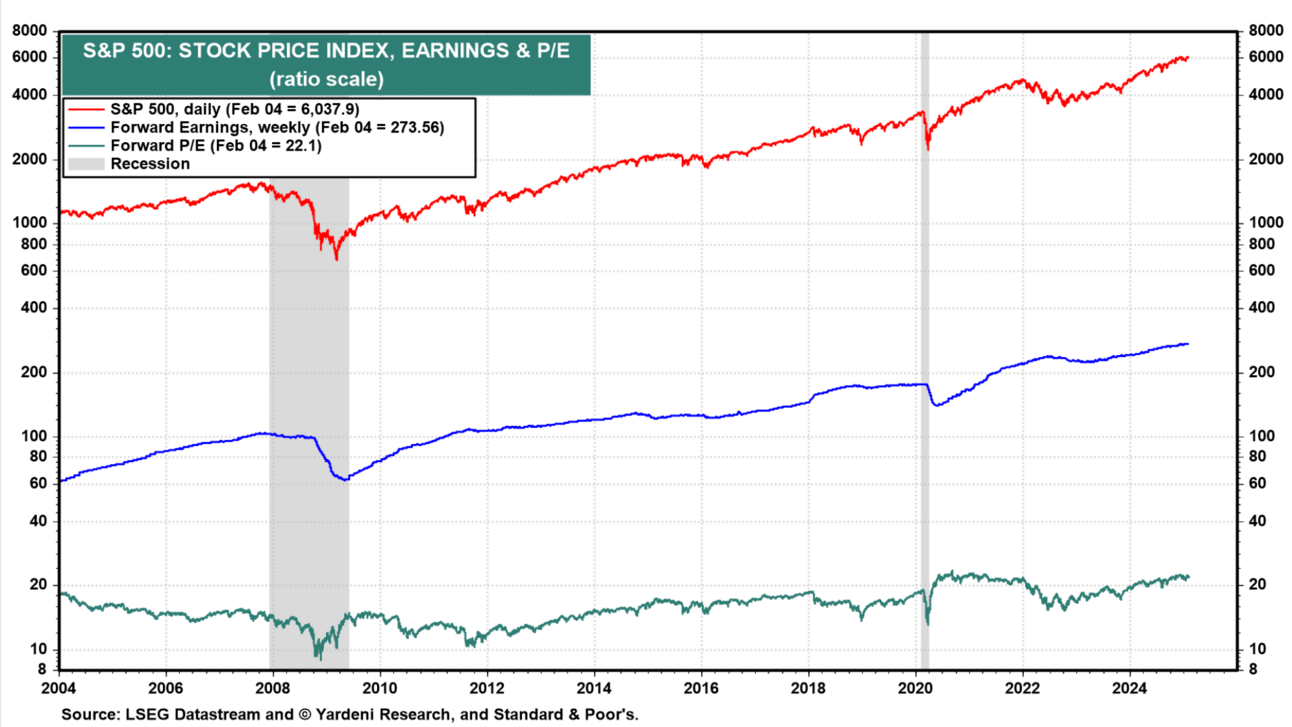
The green line on the bottom is the forward PE for the SP500 (22.1)
Look At This Chart For SP500 Trailing PE👇
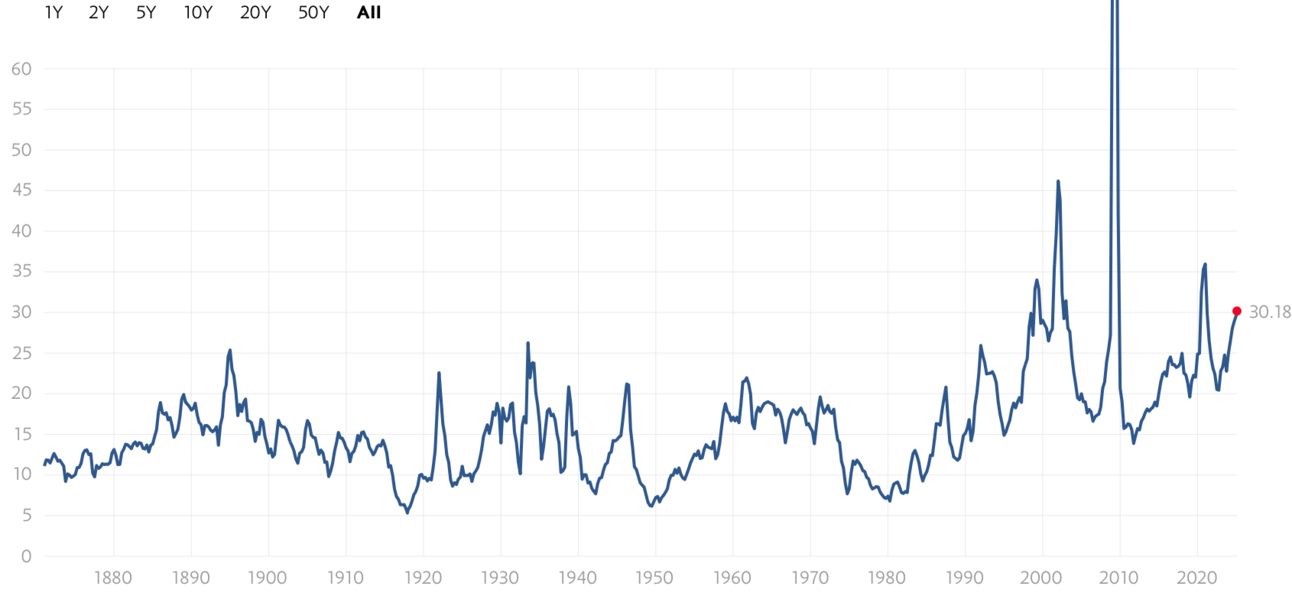
You can see, the PE ratio (30.18) for the SP500 is at levels only seen a few times in the last century.
So the reason why the trailing PE looks high (30.18) & forward looks lower (22.1) is because a lot of earnings growth is expected in the coming years.
Earnings growth while assuming no stock price growth means a lower PE.
For Example:
Company XYZ is $100 per share.
EPS for the last 12 months is $5.
That means the trailing twelve months (TTM) PE is 20
But what if the 12 months going forward into the future we expect EPS of $8.
That means the forward PE would be 100/8 =12.5
So this is why when we expect growth, forward PE is lower than trailing.
This assumes the stock price does NOT change.
So overall, yes the trailing PE ratio of the SP500 is high, but we are also expecting lots of growth in the coming years.
That is why the forward is much lower.
But That Is Not Enough Info To Make A Valuation Conclusion👇
Yes things look a little expensive now based on historical norms, but there is one key difference now vs historical norms.
INTEREST RATES.
Check out this chart below of the historical interest rates in the U.S.
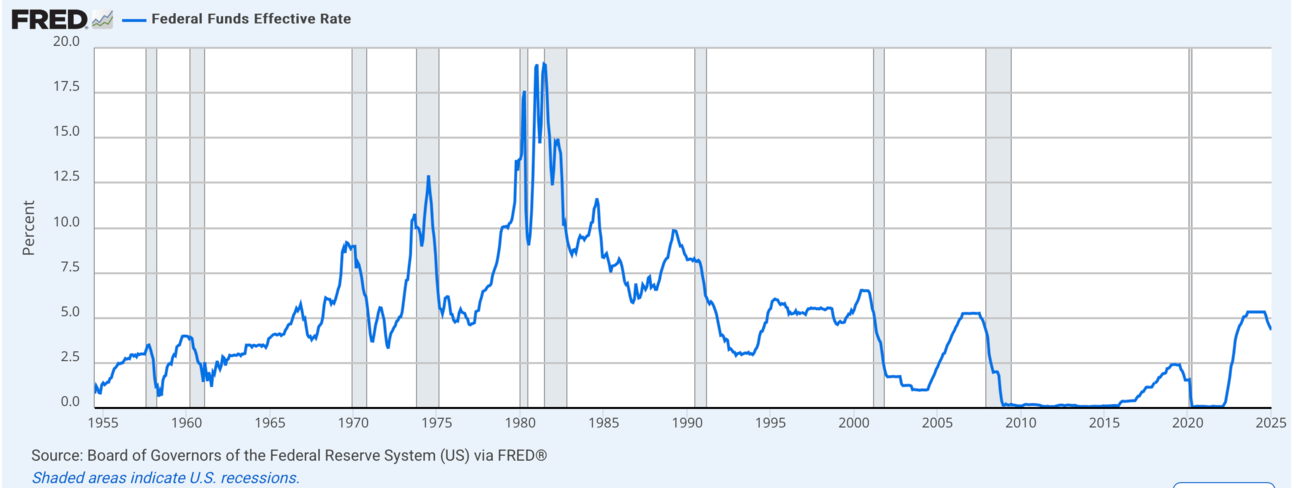
We are currently at 4.33% and more rate cuts are expected to come.
Since 1980, interest rates have been on a bumpy, but steady decline to current.
Yes I know we are “locally” higher now but we are in a cutting cycle and more are expected to come next week and next year.
I expect we will cut to around 3% ish which is what the fed indicated the neutral rate is. So we still have some more cutting to go.
So why do I care about this chart?
Well, it matters A LOT!
Rates are like gravity on the stock market.
The easiest way to explain this is with an example.
Let’s say you have $100k to invest. You can chose between a “risk free” government bond for a 9% annual interest rate, or you can choose to invest in the stock market and get a “risky” 10% annual return on average, but it is bumpy.
Most investors will go with the bond cause its a guaranteed 9% and its not worth the “risk” to chase after another 1% in the stock market.
Ok now let’s flip it. What if the bonds were at 3% and and stock market is 10%. Are most people going to waste their time with a bond? Prob not.
So that is why when rates go down, stocks usually have multiple expansion (PE ratios go higher) which means stock prices go up because there is really no other game in town.
So Based On This Info, Where Are We Now?👇
Well, things look expensive on a trailing basis (past 12 months) but looking forward, things don’t seem to be crazy expensive.
The more rate cuts we get & assuming the economy stays strong & expected earnings growth actually materializes, the higher the stock market can fly higher.
There are plenty of stocks right now that are clearly over valued and disconnected from the fundamentals.
But the indexes are what matters the most. Everything is indexed nowadays and if the index tanks, most of the companies within that index will fall too.
So the market is pricing in strong growth in the future.
There is lots of hype around deregulation with Trump, AI, Tech, and new breakthroughs to make companies much more efficient.
If that actually materializes to the bottom line of these companies (earnings), that will justify the valuations levels now.
But if the growth does not come, the market will correct lower.
Companies that have a durable competitive advantage will do great, while others that do not adopt AI and stay relevant will be destroyed.
I feel this is the Industrial Revolution but for tech right now. (roaring 20s)
So Is The Market Over Valued?👇
Maybe a little.
Earnings are the number one thing that matters to what a stock does in the long run.
Lets look at the annual growth rate for the last 5 years and add it together then compare this against what the SP500 share price did.
2020 = -32%
2021 = 110%
2022 = -12%
2023 = 11%
2024 = 14%
So if we add that up in a simple way that = 91% earnings growth in the last 5 years.
The SP500 index price went up 91% in the same time period.
Funny how that works out huh… EARNINGS MATTER!
So overall, I feel the market is pricing in a lot of growth and if the growth actually happens, we are at fair value now.
If the growth flops, we are over valued now.
I like to have a margin of safety so I will discount the future growth a little.
So right now I view us as 10% over valued ish. But keep in mind, the market can swing all over and be irrational at time both on the over valued side and under valued side.
Not saying a crash will happen, but if it does I will be capitalizing!
The key is to understand how to profit in all markets.
Click the link below to learn!
Current Thoughts In My Head👇
Day to day stock price changes don’t matter.
Be an investor, zoom out, and be patient.
Day to day movements don’t matter
The market feels a bit stretched—probably about 5-10% above intrinsic value.
Trump seems committed to keeping the economy strong and driving inflation down, which could provide stability if it actually pans out.
Earnings have been solid so far, which is exactly what’s needed to justify current stock valuations.
I’m not calling this a bubble, but things are a little expensive.
As always, be prepared for any scenario.
Economic Calendar For: Feb 3-7, 2025
All times in PST
Monday, Feb 3👇
Palantir Earnings (post market)
Tuesday, Feb 4👇
Paypal Earnings (pre market)
7a Job Openings
7a Factory Orders
Google Earnings (post market)
AMD Earnings (post market)
Chipotle Earnings (post market)
Wednesday, Feb 5👇
Uber Earnings (pre market)
Disney Earnings (pre market)
5:15a ADP Employment Data
Qualcomm Earnings (post market)
Arm Earnings (post market)
Microstrategy Earnings (post market)
Ford Earnings (post market)
Thursday, Feb 6👇
530a Initial Jobless Claims
530a US Productivity Report
Amazon Earnings (post market)
Friday, Feb 7👇
530a Employment Reports
I will be breaking all of this down in real time in course members only discord!
👇Price Targets For End Of Year 2025
(updated daily)
I moved all trades and potential plays to course members ONLY Discord!
Take your game to the next level. Do my course. Come into my mastermind Discord!
QQQ - $565
VOO- $575
IWM- $240
SOXX- $240
TSLA - $400
NVDA- $175
AAPL - $250
PLTR- $85
AMZN- $255
GOOG - $235
MSFT - $450
JPM - $275
SOFI - $12
TSM - $225
AMD - $135
META - $750
BITCOIN - $95,000
SOLANA - $240
👇Price Targets For End Of Year 2030
QQQ- $830 (assuming 8% annual ROI)
VOO- $830 (assuming 7% annual ROI)
SOXX- $360 (assuming 8% annual ROI)
TSLA- $1,200 (assuming 18% annual ROI)
NVDA- $645 (assuming 25% annual ROI)
AAPL - $375 (assuming 7% annual ROI)
AMZN- $550 (assuming 15% annual ROI)
MSFT - $1,000 (assuming 15% annual ROI)
(of course a lot of these will split, this is non split adjusted)
👇Current Value of My Trading Account👇
(updated daily)
👇Yearly Account Account Value
December 2018 - $0
December 2019 - $45,251
December 2020 - $150,191
December 2021 - $267,524
December 2022- $290,315
December 2023 - $506,223
December 2024 - $927,796
IN PROGRESS 2025 - $956,068
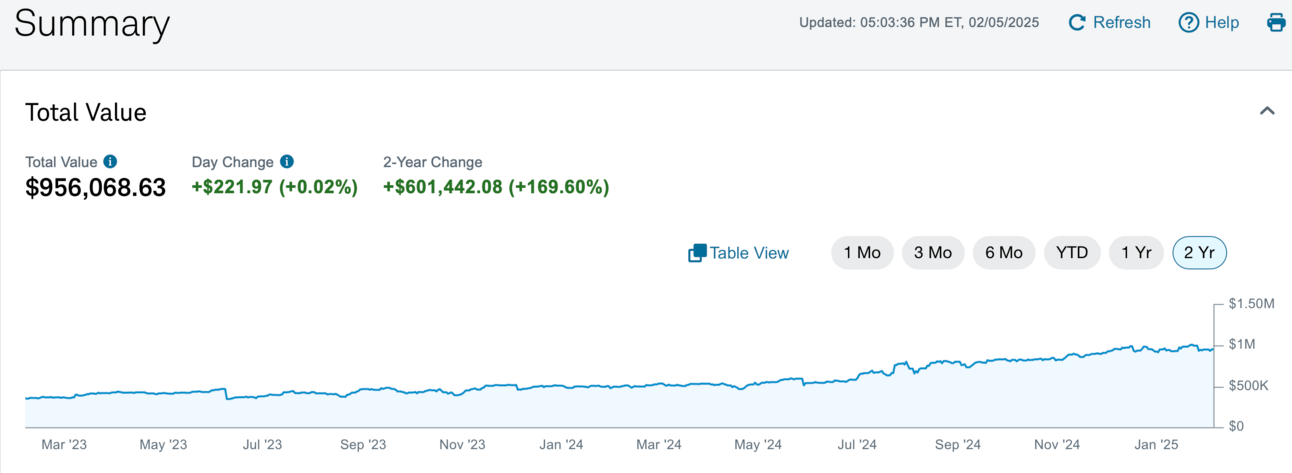
Screenshot of My Trading Account Today.
👇Portfolio Thoughts
Amazing growth from 2018 to Current all off of a total contribution of $90,000.
That is over a 10x in 7 years!
I did this in a very low risk and conservative way.
I feel the market is a little stretched & volatility is healthy and normal!
If bond yields continue to climb, I expect pain in the markets to continue.
I will continue to find great investments / options plays that will pan out to explode the portfolio in the long run.
Month to month and even year to year volatility is irrelevant.
I see volatility as opportunity!
My goal is $5,000,000 in this account by 2030.
I see this as very achievable and if the market dips further, I will capitalize heavily, just like I did in 2022!
Stay the course and keep your emotions in check!
👇How My Trades Have Performed Since 2023👇
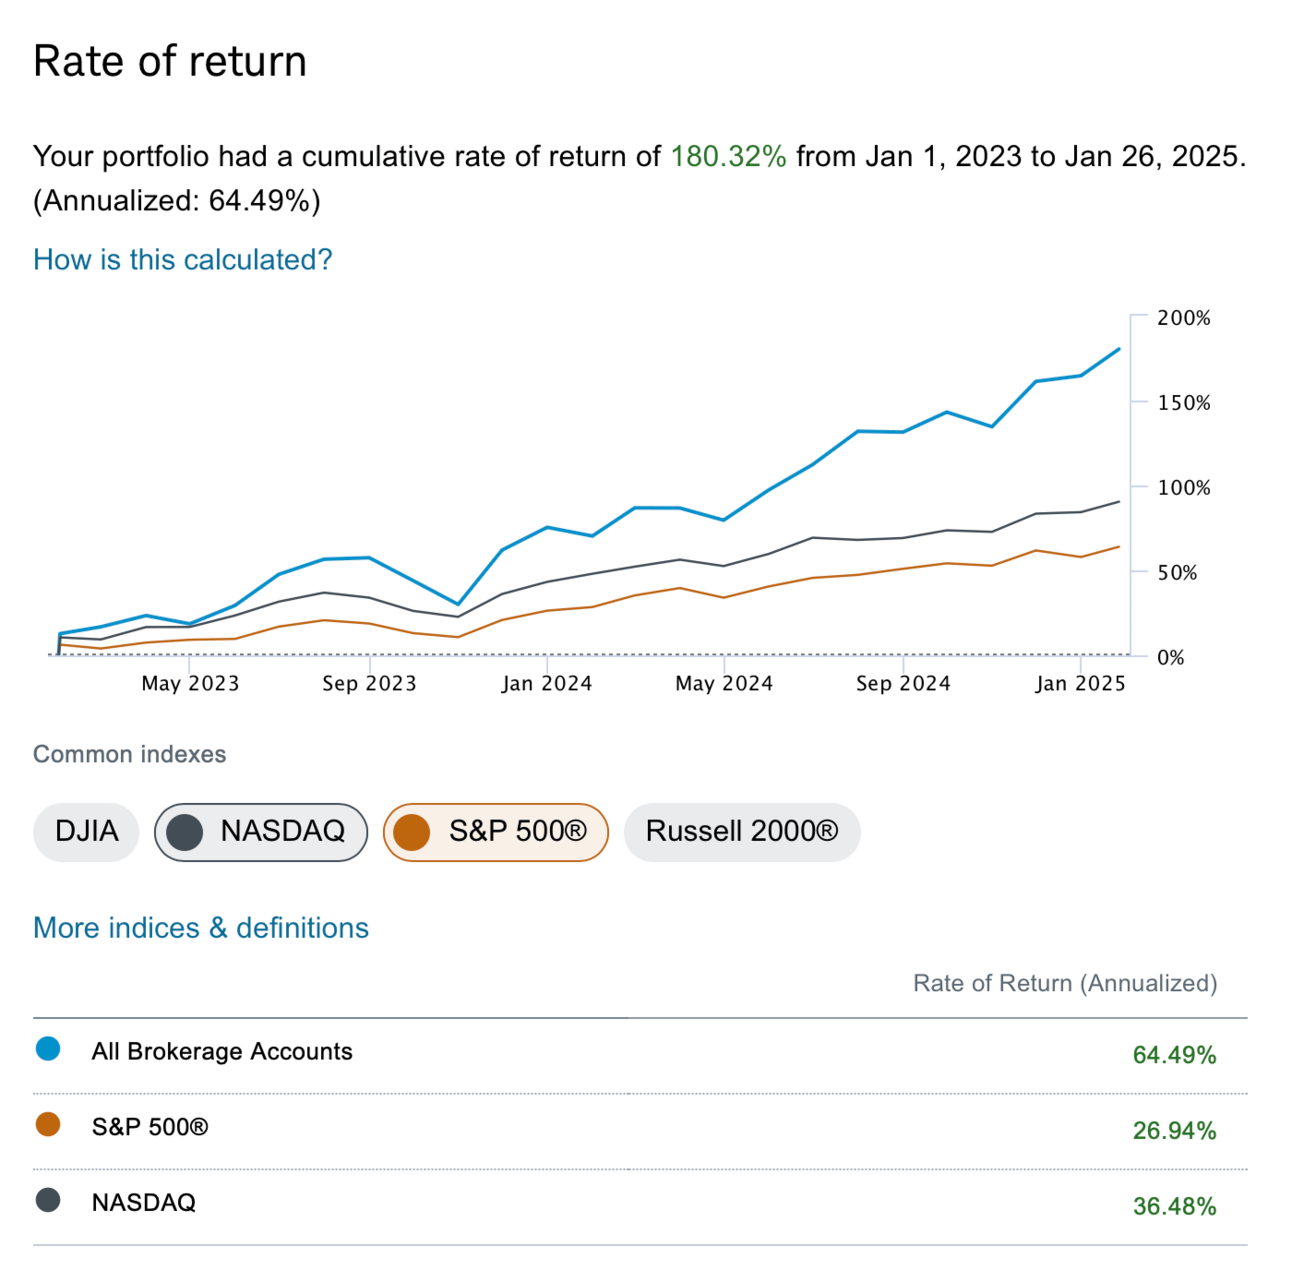
Blue = Me, Black = Nasdaq, Orange = SP500