- Investing With Brandon Alpha Report
- Posts
- Alpha Report Issue #58
Alpha Report Issue #58
This Might CRASH The Market!
Brandon
January 31, 2025
Welcome to The Alpha Report 👋
Hey guys!
I will be sending out my Alpha Report for FREE every day the market is open! I always want to create more value for you guys and this report is only going to get better! Enjoy!
-Brandon
Today’s Heat Map👇

Friday January 31, 2025 RECAP👇
Market fell into the close as Trump stands stern of tariffs.
The latest reading from the Federal Reserve's preferred inflation gauge (PCE) met forecasts, indicating that inflation is aligning with market expectations…
More on this below.
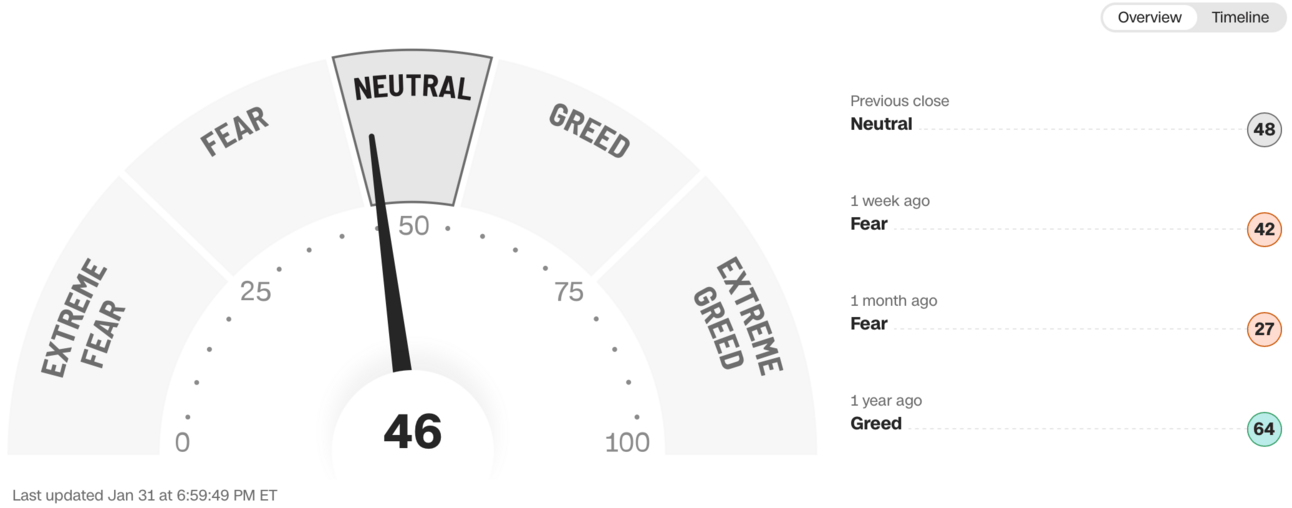
Fear & Greed Index For Today👇
46 Today & 48 Yesterday
Market dipped today and that pushed the needle to the left.
I feel that we are closer to 60 vs what this says, so a tad greedy.
The new talk on Wall Street is tariffs, and if this will lead to a trade war.
So the market fell, and the needle pushed closer to fear because of this.
Some will work for money.
Some will make their money work for them.
— Investing With Brandon (@Invest_Brandon)
3:00 AM • Jan 31, 2025
Today’s Economic Updates👇
30 year fixed mortgage rate climbs to 6.96% today vs 6.86% Yesterday.
10 year treasury bond yield climbs to 4.54% today, vs 4.52% Yesterday.
2 year treasury bond yield falls to 4.20% today, vs 4.21% Yesterday.
Today We Got PCE Data👇
The U.S. PCE price index climbed 0.3% vs. 0.3% expected.
The U.S. core PCE price index rose 0.2% vs. 0.2% expected.
The Personal Consumption Expenditures (PCE) Price Index is the Fed’s preferred inflation gauge. It captures changes in the price of goods and services consumed by households and is crucial for monetary policy decisions.
Well… This Could Be Bad👇
Trump plans to follow through with his tariffs & put them into effect tomorrow (Feb 1st)
Key Takeaways👇
Mexico: 25% tariff on imports.
China: 10% tariff on imports.
Potential tariffs on chips too.
These tariffs are part his broader strategy to address concerns related to immigration, drug trafficking, and to promote the “America First” trade policy by encouraging the purchase of American made products..
So What Happened Last Time He Didi This In 2018👇
Ok let’s look at how the market did for trumps first presidency during the trade war.
Check out this chart below of when he started the “trade war”

So March of 2018 is when Trump did tariffs in his last presidency.
This chart above on the left side starts in March of 2018.
On the right side of the QQQ chart above, you can see the percentage change.
QQQ is the nasdaq 100 tech index.
So it bounced around from roughly positive 10% to negative 10%
That is 20% from peak to trough.
So quite a bit of volatility!
But It Might Be MUCH Worse👇
Now we need to compare the state of the stock market in 2018 vs now to see if things are overall cheaper now vs then and maybe a pull back will be more likely in a more expensive environment.
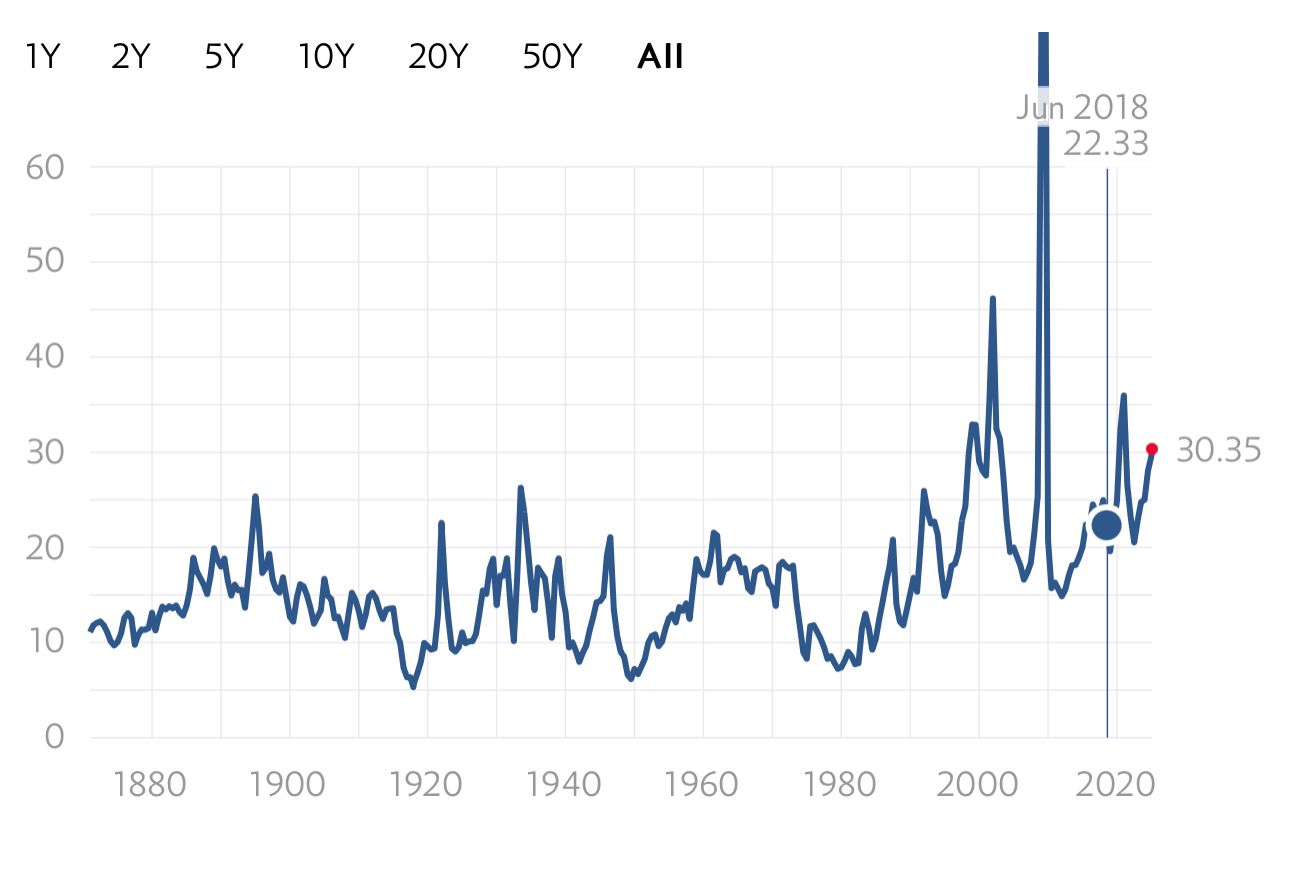
Looking at the chart above, you can see in June of 2018 the SP500 trailing 12 months price earnings ratio was 22.33
The current PE ratio of the market is 30.35.
So now we are a solid amount more expensive vs in 2018!
Often times, when the market is expensive on a fundamental basis like it is now and bad news comes out, the market is always looking for an excuse to dip lower.
Not sayin it is 100% going to happen, but be careful now & expect volatility.
One Last Metric To Look At👇
You guys know I say it a million times, Interest rates are gravity on the stock market.
If bond yields are high, in general that means stock valuations (PE Ratios) are typically lower.
If bond yields are low, in general that means stock valuations (PE Ratios) are higher.
Stocks and bonds compete with each other.
Stocks are viewed as the risky ROI.
Bonds are viewed as the risk free ROI.
So let’s look at interest rates in 2018 vs now!

In the chart above, you can see in March of 2018, the 10 year bond was at 2.86%.
Right now the 10 year bond is at 4.54%.
So in 2018, the market was cheaper from a valuation standpoint (PE Ratios) and cheaper based on the bond yield being much lower.
Ok What Does This Mean👇
So what I am getting at is right now we have a more expensive stock market fundamentally & rates that are higher which makes the stock market even more expensive on both fronts…
In 2018 we saw swings of 20% in the market when a similar situation happened.
That is not out of the picture now either… or even worse…
Not trying to sound like the big bad bear, but it’s key to only make ultra high margin of safety plays and be careful with leverage!
I am positioned to capitalize on upside & downside right now!
Economic Calendar👇
Economic Calendar For: Feb 3-7, 2025
All times in PST
Monday, Feb 3👇
Palantir Earnings (post market)
Tuesday, Feb 4👇
Paypal Earnings (pre market)
7a Job Openings
7a Factory Orders
Google Earnings (post market)
AMD Earnings (post market)
Chipotle Earnings (post market)
Wednesday, Feb 5👇
Uber Earnings (pre market)
Disney Earnings (pre market)
5:15a ADP Employment Data
Qualcomm Earnings (post market)
Arm Earnings (post market)
Microstrategy Earnings (post market)
Ford Earnings (post market)
Thursday, Feb 6👇
530a Initial Jobless Claims
530a US Productivity Report
Amazon Earnings (post market)
Friday, Feb 7👇
530a Employment Reports
I will be breaking all of this down in real time in course members only discord!
Current Thoughts In My Head👇
Day to day stock price changes don’t matter.
Be an investor, zoom out, and be patient.
Day to day movements don’t matter
The market feels a bit stretched—probably about 5-10% above intrinsic value.
Trump seems committed to keeping the economy strong and driving inflation down, which could provide stability if it actually pans out.
Earnings have been solid so far, which is exactly what’s needed to justify current stock valuations.
I’m not calling this a bubble, but let’s be real—things are a little frothy.
As always, be prepared for any scenario.
👇Check Out My Links👇
(This is ONLY my free section of discord, you will not be able to see the course members section)
👇Price Targets For End Of Year 2025
(updated daily)
I moved all trades and potential plays to course members ONLY Discord!
Take your game to the next level. Do my course. Come into my mastermind Discord!
QQQ - $565
VOO - $575
IWM - $240
SOXX - $240
TSLA - $400
NVDA - $190
AAPL - $250
PLTR - $60
AMZN - $245
GOOG - $205
MSFT - $460
JPM - $260
SOFI - $12
👇Price Targets For End Of Year 2030
QQQ - $830 (assuming 8% annual ROI)
VOO - $830 (assuming 7% annual ROI)
SOXX - $360 (assuming 8% annual ROI)
TSLA - $1,200 (assuming 18% annual ROI)
NVDA - $645 (assuming 25% annual ROI)
AAPL - $375 (assuming 7% annual ROI)
AMZN - $550 (assuming 15% annual ROI)
MSFT - $1,000 (assuming 15% annual ROI)
(of course a lot of these will split, this is non split adjusted)
👇Current Value of My Trading Account👇
(updated daily)
👇Yearly Account Account Value
December 2018 - $0
December 2019 - $45,251
December 2020 - $150,191
December 2021 - $267,524
December 2022- $290,315
December 2023 - $506,223
December 2024 - $927,796
IN PROGRESS 2025 - $952,506
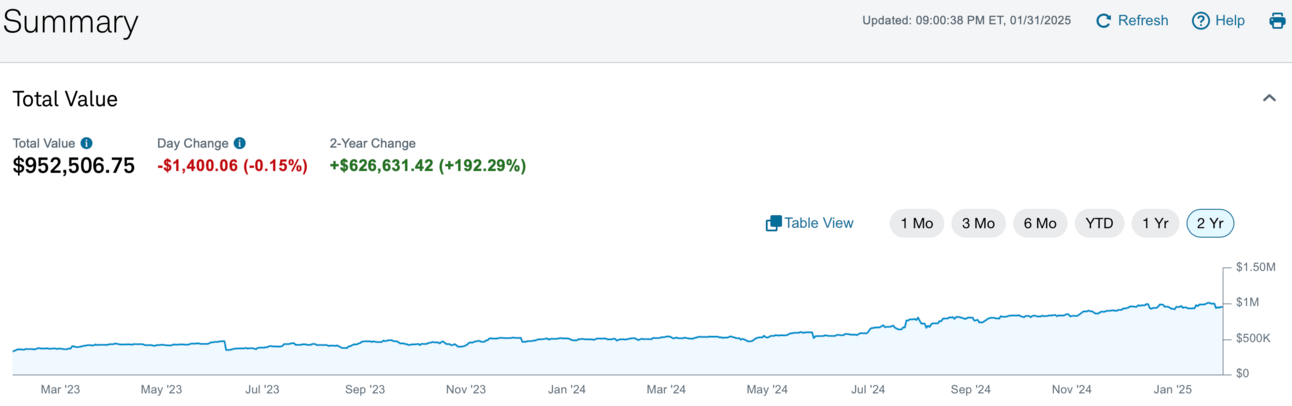
Screenshot from today. Not much action!
👇Portfolio Thoughts
Amazing growth from 2018 to Current all off of a total contribution of $90,000.
That is over a 10x in 7 years!
I did this in a very low risk and conservative way.
I feel the market is a little stretched & volatility is healthy and normal!
If bond yields continue to climb, I expect pain in the markets to continue.
I will continue to find great investments / options plays that will pan out to explode the portfolio in the long run.
Month to month and even year to year volatility is irrelevant.
I see volatility as opportunity!
My goal is $5,000,000 in this account by 2030.
I see this as very achievable and if the market dips further, I will capitalize heavily, just like I did in 2022!
Stay the course and keep your emotions in check!
👇How My Trades Have Performed Since 2023👇
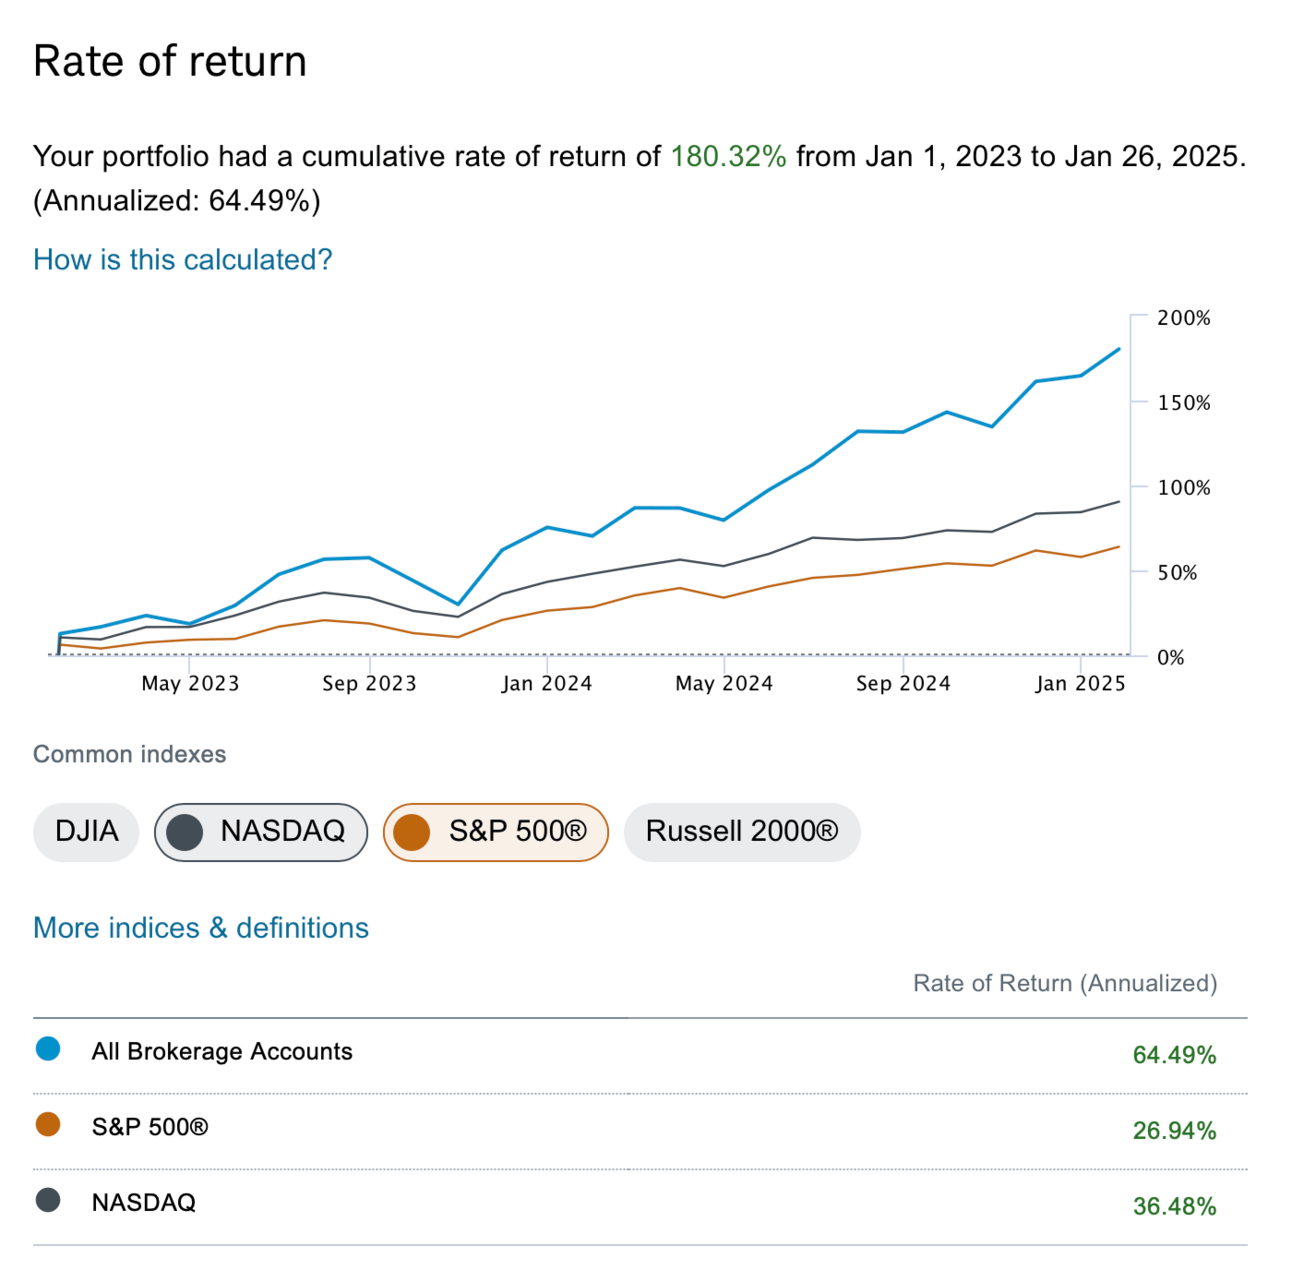
Blue = Me, Black = Nasdaq, Orange = SP500