- Investing With Brandon Alpha Report
- Posts
- Alpha Report Issue #35
Alpha Report Issue #35
Economy Cracks, But Does It Matter? KINDA
Brandon
December 26, 2024
Welcome to The Alpha Report 👋
Hey guys!
I will be sending out my Alpha Report for FREE every day the market is open! I always want to create more value for you guys and this report is only going to get better! Enjoy!
-Brandon
Today’s Heat Map👇
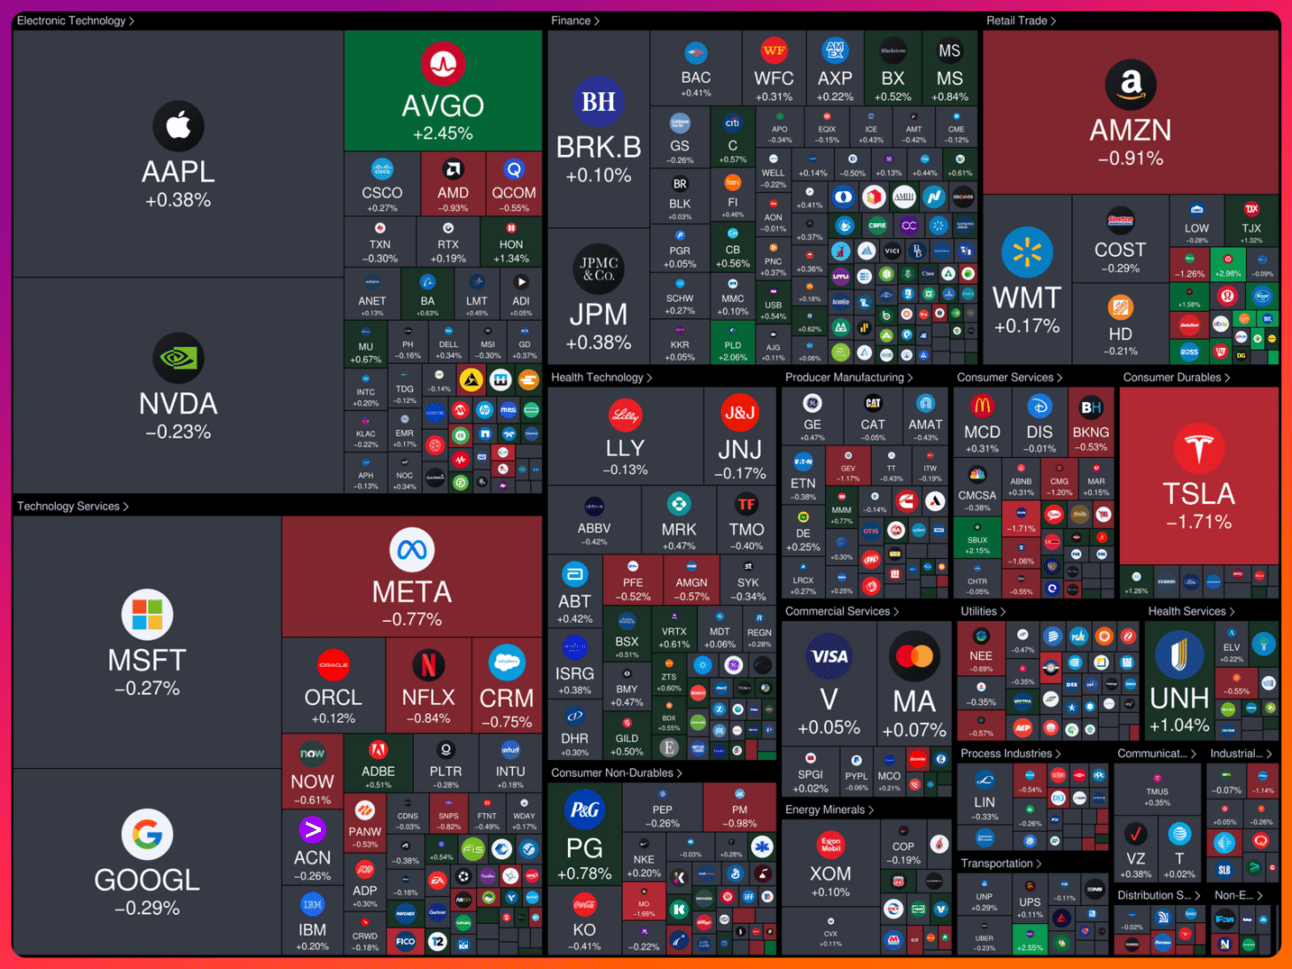
Market was flat overall today. I like flat days when things are a little over valued. Gives the market time to take a breather.
Today’s Biggest Winners/Losers👇
Nasdaq Biggest Winners✅
Nasdaq Biggest Losers❌
$VOO is about $550/share right now.
If I assume a 10% annual return for 25 years, the non split adjusted price per share of VOO would be $6,700
Everything is noise.
If it dips to $400, I won’t care.
I’ll buy more.
I have my eyes in the future at $6,700
— Investing With Brandon (@Invest_Brandon)
9:00 PM • Dec 25, 2024
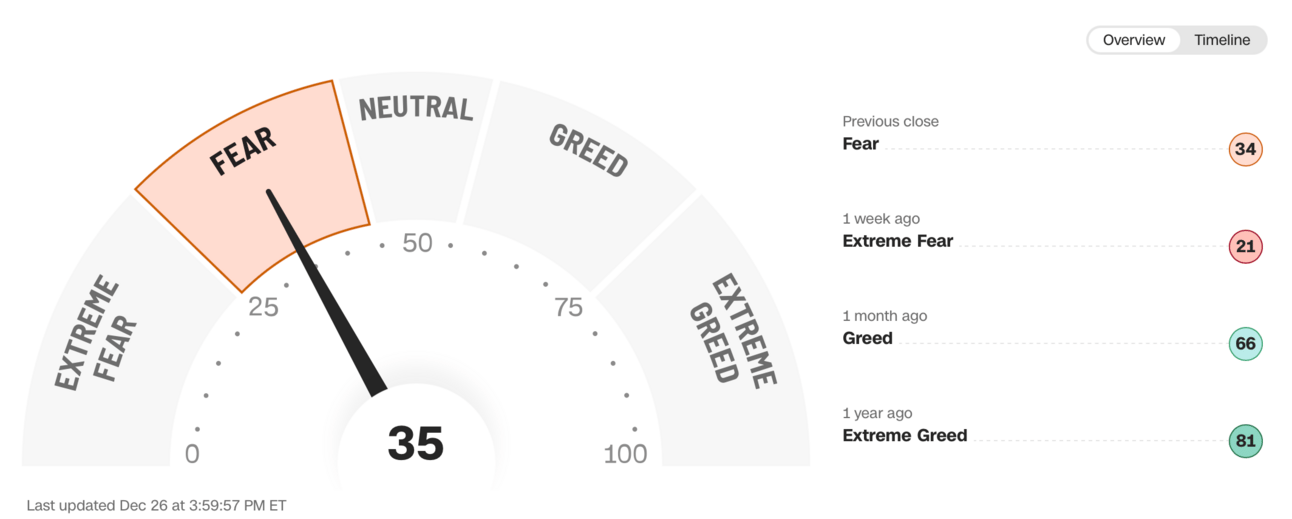
Fear & Greed Index For Today👇
30 on Tuesday & 35 Today.
The market was pretty much flat today so not much movement here.
I feel this is being a little generous and we are closer to 55 on this scale.
Be greedy when others are fearful.
Be fearful when others are greedy.
Today’s Economic Updates👇
30 year fixed mortgage rate climbs to 7.22% today vs 7.1% on Tuesday
10 year treasury bond yield flat at 4.58% today, same as Tuesday.
2 year treasury bond yield flat at 4.33% today, same as Tuesday.
Today, Initial jobless claims came in at 219k vs 220k expected.
Recurring jobless claims rose to the highest in more than three years at 1.91 million, meaning it is taking a little longer to find work.
Potential Trouble On The Horizon👇
So today we got jobs data that could be potentially bad for the economy going forward.
Let’s look at this chart below.
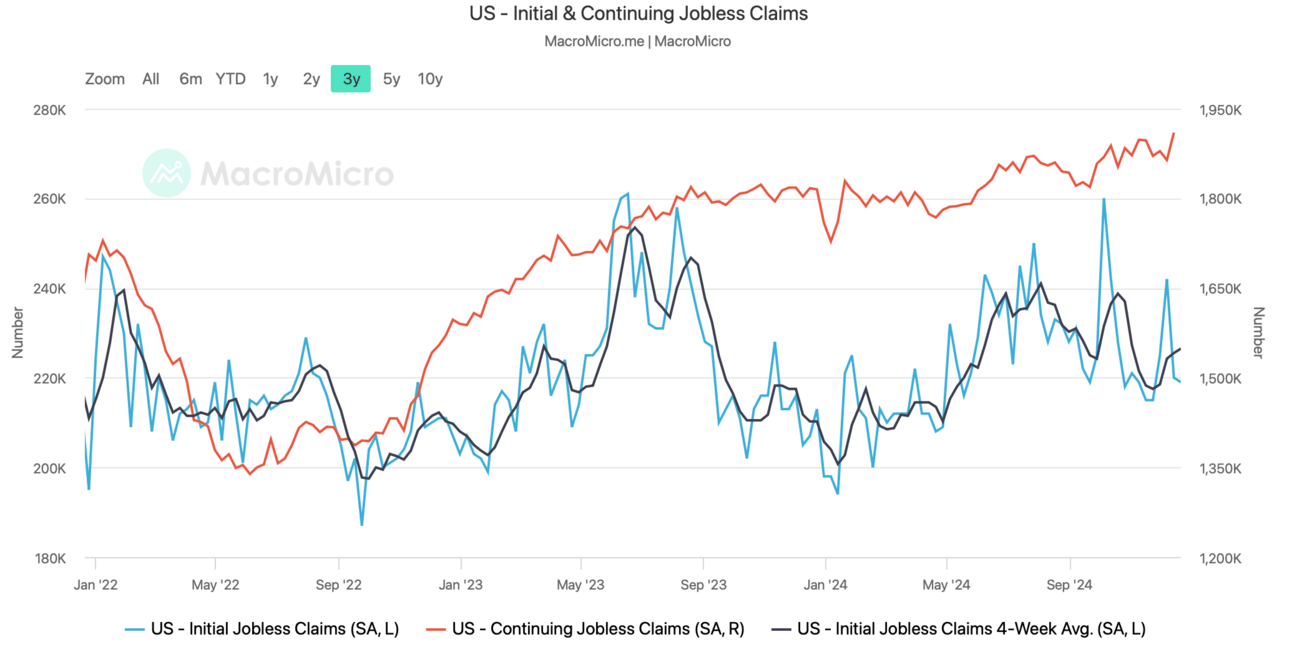
What Does This Chart Mean?👇
So the orange line is continuing claims.
The black line is initial claims.
Basically the orange line is people that are unemployed and continue to be unemployed. Black line is fresh people that are “looking for work”
So since the fed started raising rates in 2022, continued jobless claims has been on a uptrend.
The chart below shows the most recent hiking cycle and the start of cuts.
Ok Why Does This Matter?👇
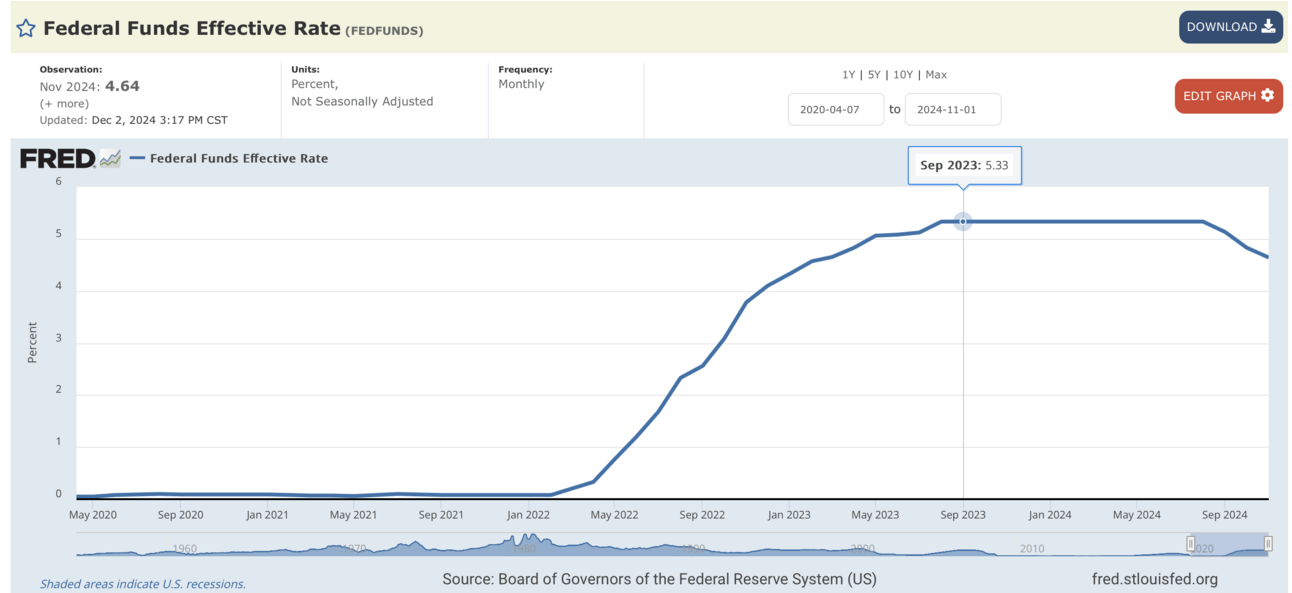
The goal of the fed is to maximize employment (have policy that accommodates the labor market) while at the same time keep inflation in check at around 2% per year.
In 2022 rates went up. This lowered demand in the economy. Borrowing costs went up. Demand went down for goods and services. Demand down = Inflation should trend down with it.
The by product of higher rates and a slower economy is unemployment.
Companies lay off workers as demand for their products goes down.
That’s why the orange line above was on a steady increase since the fed started tightening policy (raising rates)
So What Does This Mean For Stocks?👇
Well, the market last week took a dip when the fed implied less cuts for 2025.
We are expected 2 cuts vs 4.
Reason is cause inflation is sticky and hovering around 2.5-3%.
Yes this is close to target, but the fed is not claiming job finished until they see 2%.
So this is the trouble, if inflation ticks up, there is a chance we see ZERO cuts in 2025.
Basically in order to lower inflation, the fed raised rates to slow down the economy. But now the fed is in a pickle where they need to balance inflation and the jobs market. If inflation ticks up and the jobs market weakens, they are in a situation where it is hard to solve both problems at one time.
This is why most of the fed cutting cycles usually has some sort of recession or contraction in the economy. This is because the fed either cuts cause they HAVE to cause of a recession or weakening economy. Usually, by the time they cut, the recession is already here so its too late to fix, or they cut and inflation comes back so they gotta stay higher for longer and the economy can not handle higher for longer…
So at a time when valuations are lofty and inflation is sticky and cuts may come slower, I am being cautious.
I know it feels good make money, but the market can go either way from here… Up or Down.
Time will tell.
Be prepared to capitalize on additional upside and also a correction lower.
I am predicting a 7% return for 2025 with high volatility.
But Is This All Noise?👇
Kinda yes. This is why.
$QQQ is about $520/share right now.
If I assume a 11% annual return for 20 years, the non split adjusted price per share of QQQ would be $4,500+
Everything is noise.
If it dips to $400, I won’t care.
I’ll buy more.
I have my eyes in the future at $4,500+
I will leave this at that.
This is why long term investors win and using options to magnify high confidence plays is the icing on the cake!
Final Comments On Today👇
The market was flat today and bony yields continue to remain high. (implies less cuts in 2025)
I see us at 10% over valued so I am being cautious, which is what I have been saying for months.
Remember, as QUALITY stocks fall, they get cheaper and safer.
The high PE stocks fall harder in times like this.
Keep your emotions in check.
Continue to DCA into quality stocks/ETFs at good prices.
When you find undervalued companies, use options to magnify gains
Check out my links below for my course, free guides, & intrinsic value calculator!
👇Price Targets For End Of Year 2025
(updated daily)
QQQ - $565
VOO - $575
IWM - $240
SOXX - $240
TSLA - $400
NVDA - $190
AAPL - $250
PLTR - $60
AMZN - $245
GOOG - $205
MSFT - $460
JPM - $260
👇Price Targets For End Of Year 2030
QQQ - $750
VOO - $800
SOXX - $400
TSLA - $1,200
NVDA - $650
AAPL - $375
AMZN - $450
MSFT - $850
(of course a lot of these will split, but this is non split adjusted)
👇My Favorite New Trades 👇
I either plan to enter, or have already entered these trades.
These are in order from least risky to most risky!
VOO - DCA Shares - 3 year min hold duration
QQQ - DCA Shares - 3 year minimum hold duration
SOXX - DCA Shares - 3 year minimum hold duration
TSLA - DCA Shares - 5 year minimum hold duration
NVDA - DCA Shares - 2 year minimum hold duration
AMZN - DCA Shares - 2 year minimum hold duration
NVDA - Sell Puts - 1 year duration -Strike of $115
GOOG - Sell Puts - 1 year duration - Strike $165
TSLA - Sell Calls - 1 week duration - Strike $530
PLTR- Sell Calls - 2 week duration - Strike Price $100
MSTR - Sell calls - 1 week duration - Strike $100 out of the money.
(Join premium discord to see my exact trades in real time, link below)
👇Current Value of My Trading Account👇
(updated daily)
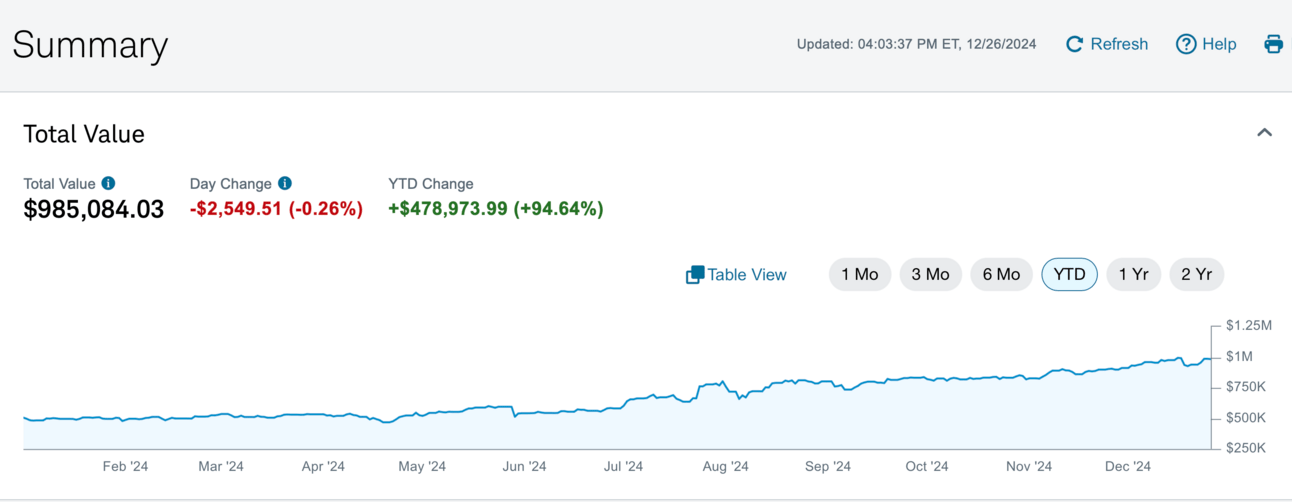
I started this year at $506,110. Currently $985,084. This is the power of doing stocks and options the right way but I do expect more volatility. I am being very cautious with options right now. I consider this account to be worth around 750k for the true intrinsic value. Not 980k+ Which means I wouldn’t be surprised if we dip more!
👇Yearly Trading Account Value
December 2018 - $0
December 2019 - $45,251
December 2020 - $150,191
December 2021 - $267,524
December 2022- $290,315
December 2023 - $506,223
December 2024 - $985,084 (in progress)
👇How My Trades Have Performed Since 2023👇
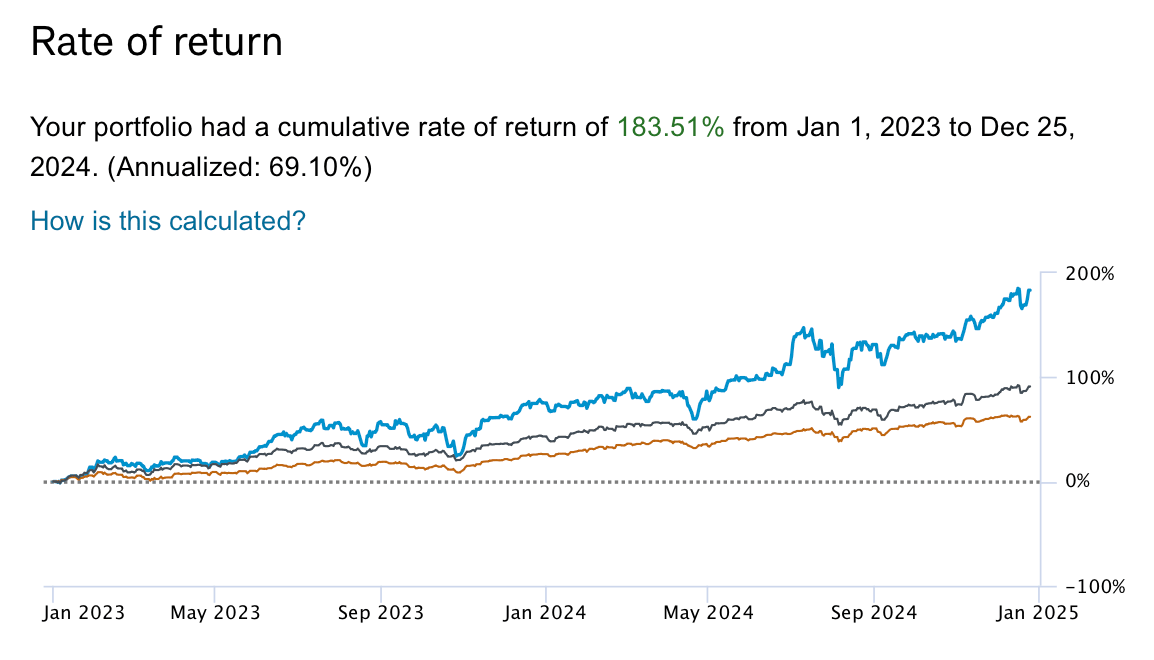
Me = Blue, Black = Nasdaq, Orange = SP500.