- Investing With Brandon Alpha Report
- Posts
- Alpha Report Issue #32
Alpha Report Issue #32
Is The Crash Over? 2025 Outlook
Brandon
December 20, 2024
Welcome to The Alpha Report 👋
Hey guys!
I will be sending out my Alpha Report for FREE every day the market is open! I always want to create more value for you guys and this report is only going to get better! Enjoy!
-Brandon
Today’s Heat Map👇

Market rebounded today after a sharp pull back the last 2 days. But is this fake out? Details below
Today’s Biggest Winners/Losers👇
Nasdaq Biggest Winners✅
Nasdaq Biggest Losers❌
Well, after 6 years of studying the markets like CRAZY and implementing my strategy, I crossed a million today in my trading account.
NEVER GIVE UP!
— Investing With Brandon (@Invest_Brandon)
5:04 PM • Dec 18, 2024
Fear & Greed Index For Today👇
23 yesterday & 28 Today.
The market bounced back today but still kept us in the fear category.
I feel this is being a little generous and we are closer to 55 on this scale.
Be greedy when others are fearful.
Be fearful when others are greedy.
Things are only down a little from ATHs. A little 5% dip is NOT a big needle mover…

Today’s Economic Updates👇
30 year fixed mortgage rate climbs to 7.07% today vs 7.01% yesterday.
10 year treasury bond yield falls to 4.53% vs 4.56% yesterday.
2 year treasury bond yield falls to 4.31% vs 4.32% yesterday.
Today we got PCE data which is important to the Fed to track progress on inflation.
Headline PCE was mild, with prices up 0.13% from October (a 1.5% annualized rate)
The 12-month rate ticked up to 2.4% from 2.3%
The 6-month annualized rate was 1.9%
The 3-month annualized rate held steady at 2.1%.
So overall inflation appears to be on track to 2%.
Markets rallied on this news that inflation is still in check and on track to the 2% target.
Why Did The Market Dip & Is It Done?
Let’s start by looking at this 5 year chart below for the SP500👇

This is a VERY important thing most people do NOT know but you need to know!
So this is a chart of the S&P500 ETF Ticker VOO. The straight line corresponds to the average earnings growth of the companies within the S&P500.
So as you can see in the end of 2021, the market was a little over valued (VOO traded above earnings line) and mid 2022 the market was undervalued (VOO below earnings line)
As you guys know, in 2022 I was aggressively positioning myself to capitalize on the next bull run.
Everyone was freaking out to sell. I was freaking out to buy.
This is how my net worth exploded to over $2m in the last few years.
Earnings are the number one thing that matters to what a stock does in the long run.
Lets look at the annual growth rate for the last 5 years and add it together then compare this against what the SP500 share price did.
2020 = -32%
2021 = 110%
2022 = -12%
2023 = 11%
2024 = 14%
So if we add that up in a simple way that = 91% earnings growth in the last 5 years.
The SP500 index price went up roughly 91% in the last 5 years too.
Funny how that works out huh… EARNINGS MATTER!
That is why on the top right of the chart, earnings and the stock price of VOO are pretty much in line.
So this indicates the market is roughly par value right now, but this is just one measure.
I can not go into all the details in this newsletter, that is what I do in my course (roughly 7 hours of video lessons, link at the bottom)
Ok So What Does This Mean?👇
According to this one breakdown above, the market appears to be close to intrinsic value.
I think we are roughly 10% over valued but it is a function of what interest rates do, how the economy holds up, how earnings do, ect…
So it is easy to make an argument the market can dip 10, 20, or even 30% next year and that would be viewed as a buying opportunity.
The market can also climb another 10 or 20% next year and that could be viewed as acceptable if all expectations come true with regards to growth and economic strength.
I prefer to be more conservative and prepare for the worst, but also capitalize on the potential upside.
If you can’t accept the volatility of the percentages I just said above this, you should NOT be investing in the stock market.
You should be educating yourself to understand volatility is not risk. Volatility is opportunity.
How To Position To Win In A Bull Market & Bear Market👇
Most people do investing all wrong.
My way is almost guaranteed to make you rich, but it will not happen overnight.
DCA into VOO & QQQ forever! I don’t care what “experts” say or what Jim Cramer says or Tom Lee or whatever other people say. DCA VOO/QQQ forever and never plan to sell. Only invest money you do not need for at least 5 years. That will almost eliminate the chance you need sell and the market is lower vs when you bought. This is called the BASE portfolio.
Once you scale the BASE to $20k minimum, then you can dabble in options. This is where the magic happens and I currently generate about $30k/mo+ with options. Then I take options profits and buy more of the BASE portfolio.
I STRONGLY recommend you read all 20 books on my Discord in the “Brandons favorite books” channel. Also do my course in combination with that. (links at bottom)
I am willing to bet that anyone who does what I just said there will know more than 99.9% of people on earth about investing and you will dominate the market in the long run.
The choice is yours.
9-5 job forever, or take this serious.
I made my decision 6 years ago.
Here is my YouTube video I just dropped today of me explaining my journey from $0 to over $2 million👇
Final Comments On Today👇
The market bounced back after a much needed dip but the pain may not be over as outlined above.
I see us at 10% over valued so I am being cautious, which is what I have been saying for months.
Remember, as QUALITY stocks fall, they get cheaper and safer.
The high PE stocks fall harder in times like this.
Keep your emotions in check.
Continue to DCA into quality stocks/ETFs at good prices.
When you find undervalued companies, use options to magnify gains
Check out my links below for my course, free guides, & intrinsic value calculator!
👇Price Targets For End Of Year 2025
QQQ - $530
VOO - $575
IWM - $240
SOXX - $240
TSLA - $390
NVDA - $190
AAPL - $245
PLTR - $60
AMZN - $240
GOOG - $200
MSFT - $460
JPM - $250
👇Price Targets For End Of Year 2030
QQQ - $750
VOO - $800
SOXX - $400
TSLA - $1,200
NVDA - $650
AAPL - $375
AMZN - $450
MSFT - $850
(of course a lot of these will split, but this is non split adjusted)
👇My Favorite New Trades 👇
I either plan to enter, or have already entered these trades.
These are in order from least risky to most risky!
VOO - DCA Shares - 3 year minimum hold duration
QQQ - DCA Shares - 3 year minimum hold duration
SOXX - DCA Shares - 3 year minimum hold duration
TSLA - DCA Shares - 5 year minimum hold duration
NVDA - DCA Shares - 2 year minimum hold duration
AMZN - DCA Shares - 2 year minimum hold duration
NVDA - Sell Puts - 1 year duration -Strike of $110
GOOG - Sell Puts - 1 year duration - Strike $165
TSLA - Sell Calls - 1 week duration - Strike $475
PLTR- Sell Calls - 2 week duration - Strike Price $100
MSTR - Sell calls - 1 week duration - Strike $100 out of the money.
(Join premium discord to see my exact trades in real time, link below)
👇Current Value of My Trading Account👇
(updated daily)

I started this year at $506,110. Currently $939,415. This is the power of doing stocks and options the right way but I do expect more volatility. I am being very cautious with options right now. I consider this account to be worth around 750k for the true intrinsic value. Not 900k+ Which means I wouldn’t be surprised if we dip more!
👇Yearly Trading Account Value
December 2018 - $0
December 2019 - $45,251
December 2020 - $150,191
December 2021 - $267,524
December 2022- $290,315
December 2023 - $506,223
December 2024 - $939,415 (in progress)
👇How My Trades Have Performed Since 2023👇
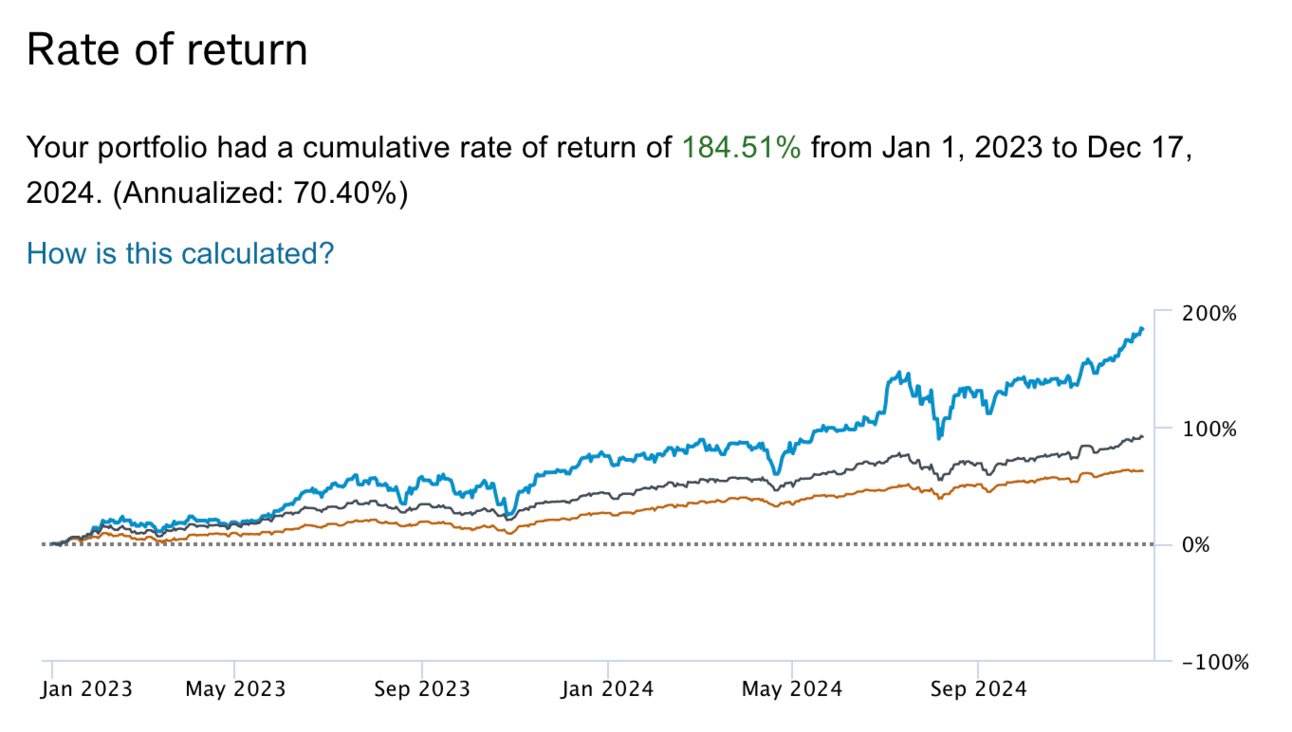
Me = Blue, Black = Nasdaq, Orange = SP500.