- Investing With Brandon Alpha Report
- Posts
- Alpha Report Issue #1
Alpha Report Issue #1
Election, Market Valuations, Big Trades, Storm Brewing.
Brandon
November 06, 2024
Welcome to The Alpha Report 👋
If you want to make millions in the stock market like me, you’re going to wanna read this. Trusted by hundreds of other millionaires.
Today’s Report Will Cover
✔️Major News Today
✔️Million Dollar Lesson
✔️The GOOD & The BAD of Earnings Season
✔️Potential New Trades
✔️Current Valuations of The Market
✔️Economic Data On Deck
✔️Open Trades In My $800k+ Trading Account
(5 minute read)
Hey guys!
I will be sending out my Alpha Report for FREE every day the market is open! I always wanted to create more value for you guys and this report is only going to get better! Enjoy!
-Brandon
Today’s Heat Map:

Major News Today:
Trump Wins
Market is pumping on the heels of Trumps pro business policies
Mortgage rates climb to 7.2% for 30 year fixed
Stock valuations continue to increase (overvalued)
Fed interest rate decision on deck (25bps cut priced in)
Most of the big tech stocks reported earnings already (was relatively good)
Million Dollar Lesson:
Most people hear stories of how their co workers or neighbors made a fortune with stock options.
You start dreaming that can be you with overnight riches.
You YOLO part of your savings into options hoping you will strike gold.
Before you know it you lost everything and you don't know what to do.
I have seen this HUNDREDS of times with new and even expert investors.
Most people do options completely wrong!
You should ONLY use options when you have very high conviction in the trade.
Do NOT shoot darts at a wall and hope to get a bullseye.
You should only make trades when you have an edge. When the market is undervalued.
When you have a buffer. When you have margin of safety.
Fear & Greed Index For Today

The GOOD & BAD of Earnings Season So Far
My Favorite company so far: GOOG
CURRENT PRICE: $173
Q3 24 EPS: $2.12
Q2 24 EPS: $1.89
Q1 24 EPS: $1.89
Q4 23 EPS: $1.64
Total TTM EPS: $7.54
173/7.54 = 23.8 PE trailing.
EPS same quarter last year was $1.55 vs $2.12 now. 37% YoY earnings growth
Guess what the stock is up in the last year... 37%!!!
THIS IS UNDERVALUED IN MY OPINION.
My LEAST Favorite company so far: AMD
CURRENT PRICE: $143
Q3 24 EPS: $0.92
Q2 24 EPS: $0.69
Q1 24 EPS: $0.62
Q4 23 EPS: $0.77
Total TTM EPS: $3.00
143/3.00 = 51 PE trailing.
EPS same quarter last year was $0.70 vs $0.92 now. 31% YoY earnings growth
Guess what the stock is up in the last year... 64%
THIS IS OVERVALUED IN MY OPINION

Potential New Trades:
Google 1 yr+ play (buy calls/sell puts)
Amazon long term play 3+ yrs (sell puts/buy shares)
Nvidia on dip (Buy Shares)
"More money will give you more problems"
So will poverty
I'd rather have money and problems, than money problems
Read that again
— Investing With Brandon (@Invest_Brandon)
11:00 PM • Nov 5, 2024
Current Valuations of The Market
The S&P 500 (Ticker: VOO) at a PE ratio of about 21 right now, we are a little lofty. (But not crazy expensive) BUT, rates are expected to fall and I agree with the expectations. Rates are like gravity on the market. If rates fall, stocks become the only game worth playing, which will push up valuations.
The Nasdaq 100 (Ticker: QQQ) at a PE of 31 is a little lofty also. So how do we value that? What do we price in? How much will Ai play into this growth? All things that nobody on earth knows 100% Me personally, I feel the earnings growth of the Nasdaq (QQQ) will be higher vs what the SP500 does. That is why QQQ is justified to get a higher PE ratio. Being its priced at a PE of 31, that is not crazy over valued in my opinion. Especially in an environment that is expecting lower interest rates. Most people do NOT put enough emphasis on how big of a deal rates are...
Rates are gravity. We are currently at 5% fed funds rate now. We are expected to be at 3.5 in a year. 1.5% is a decent cut and that will make a difference.
Economic Data On Deck:


Tip of The Day:
ONLY make a trade on something you truly understand. You need to understand the risks, benefits, valuation of the company, competition, moat, interest rates, pricing power, ect…
DO NOT make a play based on hype, fear, and greed.
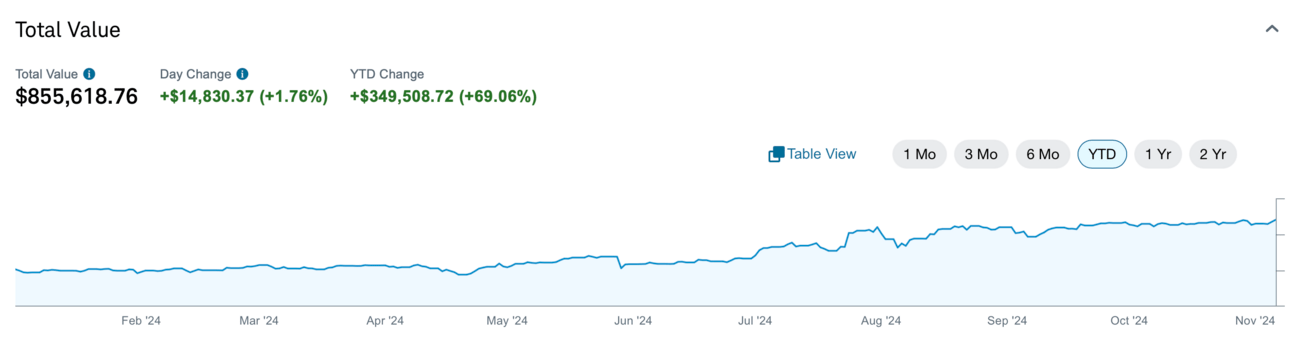
Current Value of My Trading Account
All Positions Currently Open In My Trading Account:
Ticker | Quantity | Trade Type | Strike Price | Date Trade Opened | Expiration Date |
|---|---|---|---|---|---|
QQQ | 815 | BUY | NA | DCA | NA |
VOO | 520 | BUY | NA | DCA | NA |
TSLA | 500 | BUY | NA | 1/25/23 | NA |
TSLA | 10 Contracts | Sold Puts | 170 | 4/9/24 | 6/20/25 |
QQQ | 10 Contracts | Sold Puts | 350 | 12/18/23 | 12/20/24 |
QQQ | 10 Contracts | Sold Puts | 350 | 1/31/24 | 6/20/25 |
QQQ | 10 Contracts | Sold puts | 345 | 1/31/24 | 1/17/25 |
QQQ | 10 Contracts | Sold Puts | 400 | 6/7/24 | 12/19/25 |
AAPL | 10 Contracts | Sold Puts | 220 | 8/1/24 | 12/19/25 |
IWM | 10 Contracts | Sold Puts | 215 | 7/16/24 | 6/20/25 |
TLT | 20 Contracts | Bought Calls | 101 | 9/12/24 | 3/21/25 |
TLT | 10 Contracts | Bought Calls | 95 | 11/4/24 | 6/20/25 |
MSFT | 10 Contracts | Sold Puts | 350 | 10/8/24 | 6/20/25 |
GOOG | 10 Contracts | Sold Puts | 145 | 10/16/24 | 9/19/25 |
GOOG | 10 Contracts | Sold Puts | 155 | 10/30/24 | 9/19/25 |
Wanna get this report every day? SUBSCRIBE HERE👇
Learn To Invest In Stocks & Options Like Me👇
Get My FREE Intrinsic Value Calculator👇
Get My FREE Stock Market Blueprint👇